A Daily History of Holes, Dots, Lines, Science, History, Math, Physics, Art, the Unintentional Absurd, Architecture, Maps, Data Visualization, Blank and Missing Things, and so on. |1.6 million words, 7500 images, 4.9 million hits| Press & appearances in The Times, Le Figaro, Mensa, The Economist, The Guardian, Discovery News, Slate, Le Monde, Sci American Blogs, Le Pont, and many other places… 5000+ total posts since 2008.

Category: Information, Quantitative Display of

  • Beautiful Ball Bearings, II

    JF Ptak Science Books  Quick Post

    Ball bearings are exceptionally important and have a long history, I mean, long stretching back more than 2000 years (in its most primitive form), finding formative articulation in the Renaissance, and then their first patent in 1869.  They are important parts in the history of technology, metaphorically similar to the elevator brake in the development of skyscrapers.  And they can be lovely objects in addition to their fine engineering and application. 

    The Bearings Company of America (of Lancaster, Pennsylvania, established in 1897) published a fine catalog (in 1938) for their products, including a few pages of photos of their gorgeous goods.  Sometimes photographs like these have as much artistic impact as the techno works of Paul Strand and Dorothea Lange–the images are just fine.  

    Ball bearings710


    Ball bearings709


  • A Beautiful Regression (1877)

    JF Ptak Science Books   Quick Post

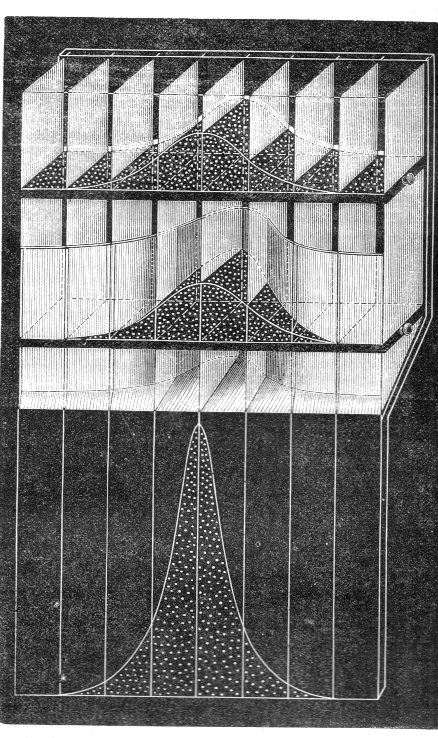
    This beautiful bit of data visualization was a significant development in the history of statistics and was employed in pioneer Sir Francis Galton’s “Typical Laws of Heredity, III”, which appeared in Nature magazine on April 19, 1877.  

    Galton707[Image: Francis Galton, “Typical Laws of Heredity, III”, Nature. p 513, April 19, 1877] 

    This contribution by Galton is the “first major step in the development of correlation and regression analysis” according to Judy Klein’s Statistical Visions in Time: A History of Time Series Analysis, 1662-1933, (page 131). She continues: 


  • Display of Data: WWII Resource Material Maps

    JF Ptak Science Books   Quick Post

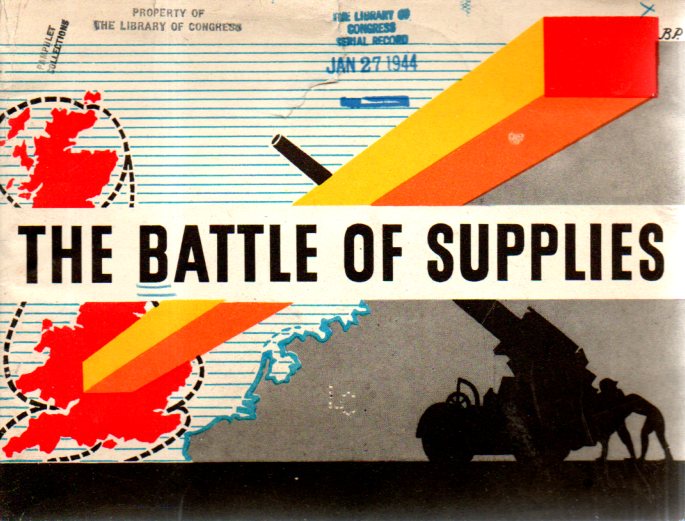
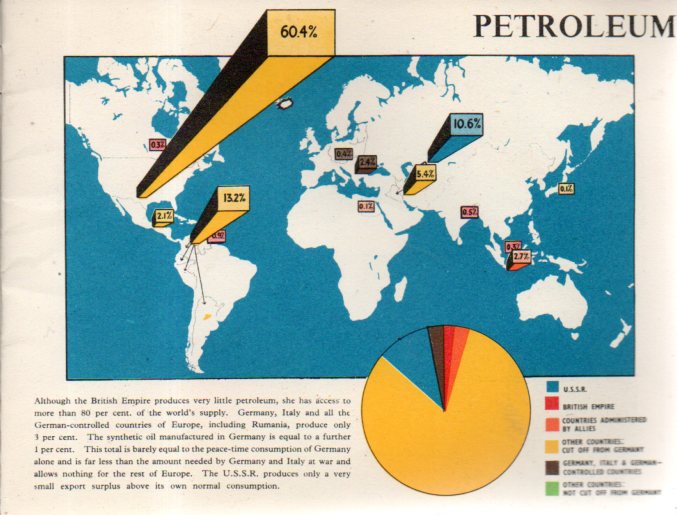
    The Battle of Supplies (1944) is an interesting propaganda publication, simultaneously celebrating achievements and promoting the new for greater production.  The method of displaying the relatively simple data is pretty striking.

    Maps--battle supplies693

    Maps--battle supplies694


  • A Note on “Hiding” in Plain Site: Razzle Dazzle Camouflage, 1917-1918

    JF Ptak Science Books  (Fixing an earlier post from 2011)     Part of a series on the History of Blank, Empty and Missing Things.

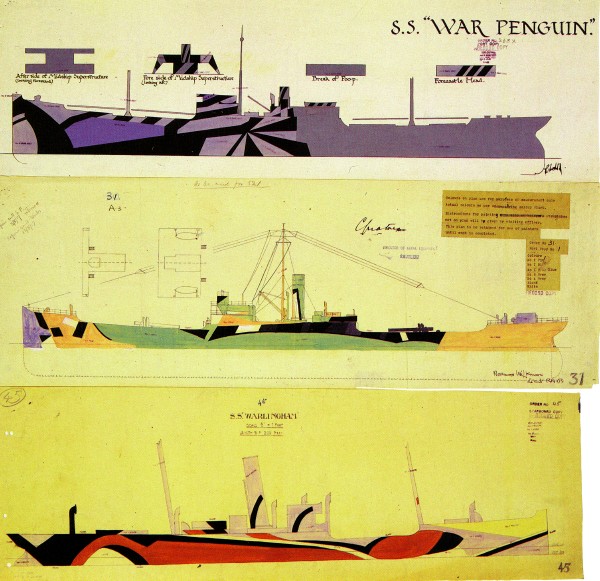
    In the history of defensive warfare it was a revolutionary idea that painting the entirety of large ocean-going  ship in sharp geometric shapes and in dazzling colors would make the ship in essence–disappear, a sort of camouflage-without -camouflage (sorry Flannery O’Connor).  It wasn’t like biological camouflage where all sorts of bits come into play to make an animal blend into its surrounding environment to protect it from predators, or conversely to make it a better predator by allowing the animal to stay completely hidden until their prey could do nothing but become their prize.  Nor was it really like thermoregulation, or sexual or warning signals (again drawing from the bio world)–it was simpler than that, though are there many relational examples in the biological world as well. Nor was it similar to the camouflage schemes used by the air corps, with different and usually sky/ground-blended colors used for the top and bottom of SPADS and Nieuports and Albatrosses.

    The effect of using the geometrical shapes on the whole of a 600′-long vessel was to make the speed and direction  of the ship more difficult for offensive pursuit vessels like submarines to figure out and calculate so that the point-to-target launch of their torpedo would be far more complicated. 
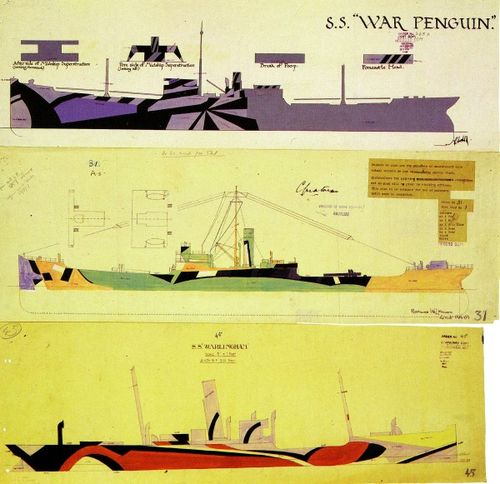
    Razzle dazzle via gotouring

    [Examples of razzle dazzle camouflage from the GoTouring website, here.]  [A very nice selection of images can also be found at iO9.com, here; also, an even larger one, here, from Public Domain Review]

    When the prolific maritime painter Norman Wilkinson (1878-1971) came to this realization for disguising the intentions of ships (around 1917) he instantly recognized its applicability in anti-submarine warfare:  not only would it be difficult to distinguish bow/stern properties of a ship, but also how long it was, and whether it was coming or going, and how big it was–all major factors in determining the launch of a torpedo.  Basically, dazzle camouflage made it difficult to produce a trajectory for the ship.

    This must have been an extraordinary experience, seeing these things for the first time by military commanders, who not but a few years earlier were sending troops into combat with white gloves and red pantaloons. 

    In a “Letter to the Editor” (“Camouflage of Ships at War”) in Nature (19 June 1919), Wilkinson explains his dazzle approach, saying that the whole point of this sort of camouflage was not necessarily “obliterative” as in biological camouflage, but rather was intended to “upset a submariner commander’s estimate of a vessel’s course, when carrying out an attack with torpedo”, and stating further that it was not intended for “ships of the line” or to help deceive topside gunnery from another ship, especially at greater distances where the paint would simply not come into play.   [An often-used but never-cited quote from a Wilkinson “lecture”  runs as follows:  “The primary object of this scheme was not so much to cause the enemy to miss his shot when actually in firing position, but to mislead him, when the ship was first sighted, as to the correct position to take up. [Dazzle was a] method to produce an effect by paint in such a way that all accepted forms of a ship are broken up by masses of strongly contrasted colour, consequently making it a matter of difficulty for a submarine to decide on the exact course of the vessel to be attacked…. The colours mostly in use were black, white, blue and green…. When making a design for a vessel, vertical lines were largely avoided. Sloping lines, curves and stripes are by far the best and give greater distortion.”]

     http://upload.wikimedia.org/wikipedia/commons/3/3d/SS_Empress_of_Russia_1918_cropped.jpg

    [ Another example of razzle dazzle at work: RMS Empress of Russia, from the University of British Columbia, here]

    File:Dazzle-ships in Drydock at Liverpool.jpg[Image source: Wikipedia, here.]

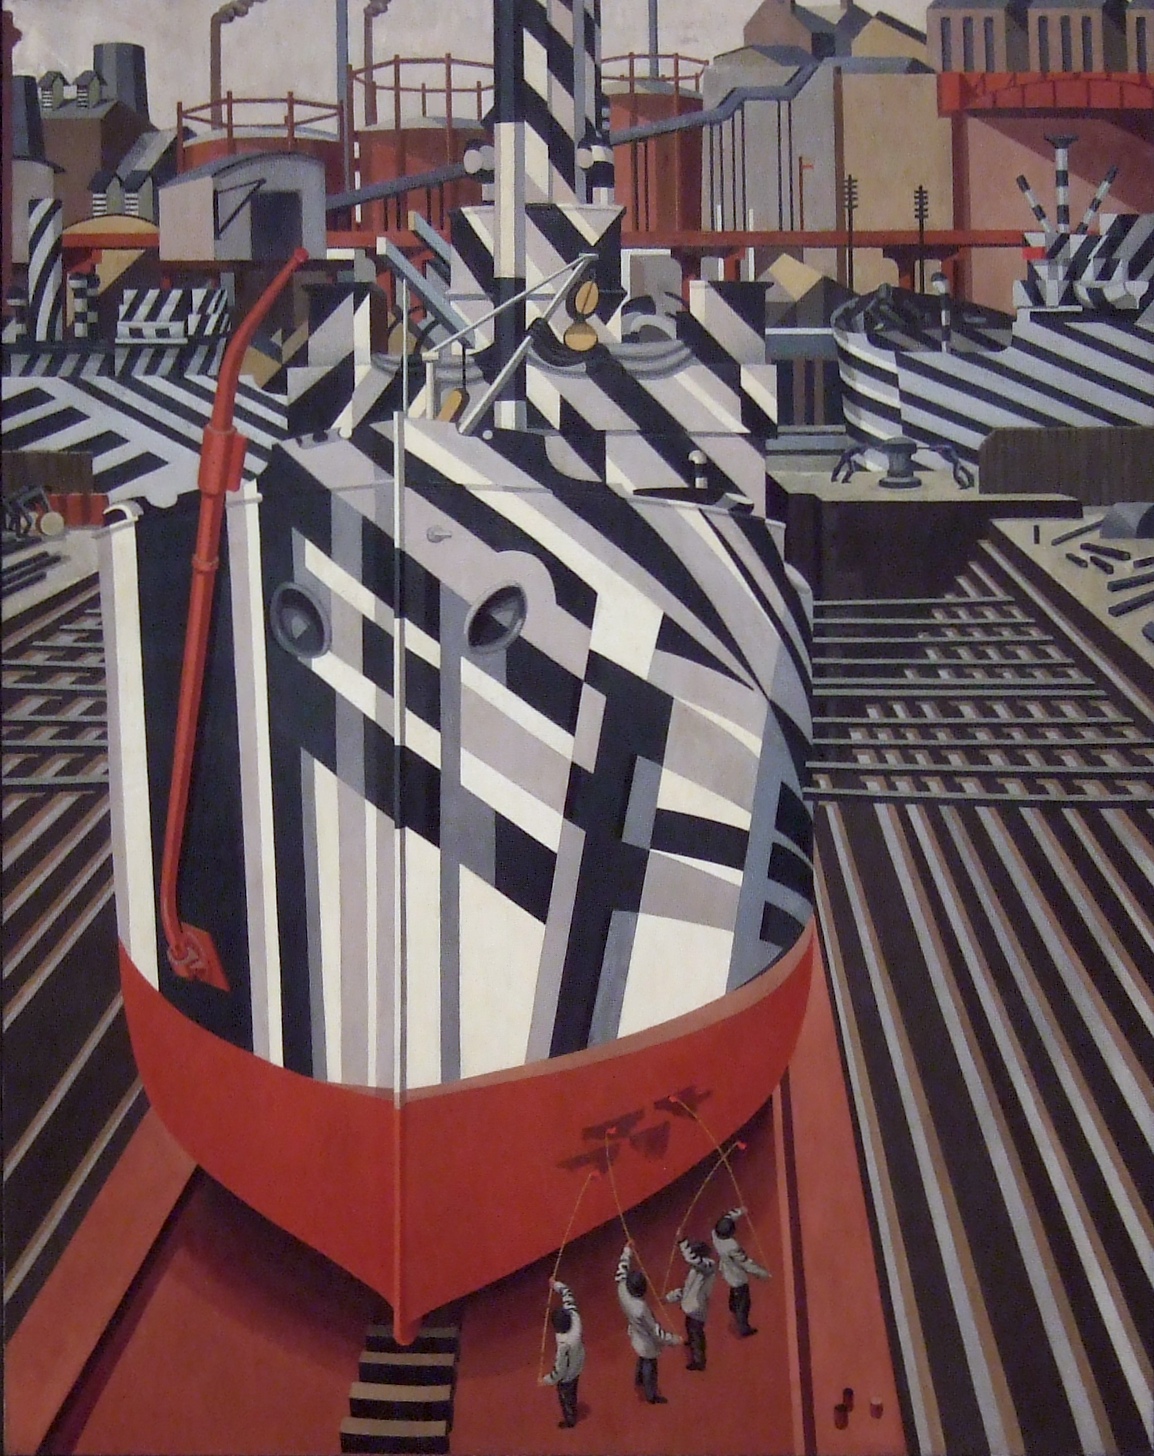
    Edward Wadsworth (1889-1949)  produced razzle dazzle designs during the war and also painted about it afterwards–something one really doesn’t see much of–in his fine  Painting of Dazzle-ships in Drydock, completed in 1919. (More of Wadsworth’s works, as prints, here.) There are well-known stories of great artists–like Villard among many others as well as the questionable Picasso, who claims to have originated the idea, along with Cubism itself–who made contributions in this effort, from making designs to doing the actual painting.  But it was the estimable Wilkinson who made the major contribution and invention of dazzle-at-sea.  

    The concept is still used, with more advanced applications, and appears on one of the world’s stealthiest ships, Sweden’s Visby Corvette.  Apart from having an exceptionally low magnetic signature, it also has geometric low-radar reflective gray dazzle paint. (It also has applications for land warfare use in the camouflage of armored vehicles against RPGs.).




  • Underestimating the Mechanics of the Invasion of England, 1940

    JF Ptak Science Books    Post 2397                                  Part of a long series on the Display of Quantitative Data

    England was last invaded in 1688 by the Dutch republic, following twelve other attempts from 1066, but Adolf Hitler was half-determined to do so (and several of his leading generals who were not-at-all determined, anti-determined to do so) himself, trying to follow in the lost  footsteps of Napoleon with Operation Sea Lion (Unternehmen Seelöwe). Napoleon failed of course, as did his predecessors: three French, two Spanish, and an Austrian attempt since 1707. And so would Hitler, although he would never come close to implementing much outside of his terror attacks on cities in the U.K. and the war waged on the RAF (and particularly Fight Command)–control of the air being integral to any sort of invasion that he might try to mount.

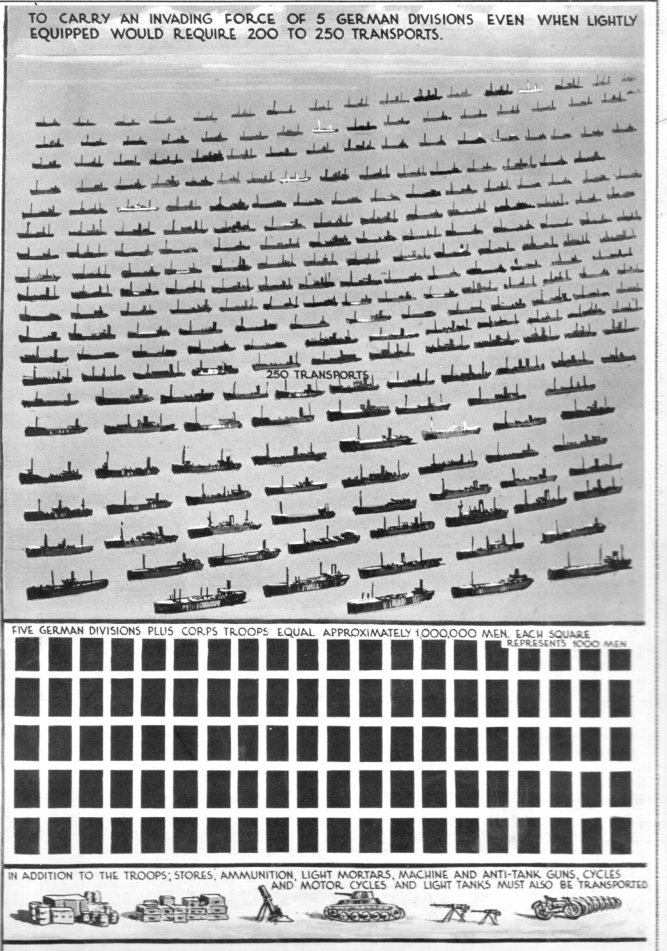
    It was at the beginning of this air attempt–the Battle of Britain–that the following interesting  small graphic appeared in the Illustrated London News  (June 29, 1940), a featurette on what it would require for the Germans to mount a successful invasion of England. Interestingly the Brits had just mobilized their own floatilla for the evacuation of Dunkirk just weeks (26 May-4 June 1940).  

    The German armada pales in comparison….

    Data vis German invasion England662


    Some part of it doesn’t make sense to me, (sitting here quietly in the future, not having Nazis flying overhead trying to kill my country)–like a convoy of troop carrier set at 250 to carry a million soldiers into the U.K.   Plus there were all of the stuff of invasion–food, supplies, support, materiel of all shapes and sizes and description, and on and on.  The D-Day invasion force used 6,939 vessels, 1,213 naval combat ships, 4,126 landing ships, 864 merchant vessels, and 736 other ships, not to mention the 3000+ aircraft and gliders, all in use toland 156k soldiers along a 50 mile front in Normandy. An utterly understated spectacular undertaking–and no doubt the Germans would have had to do something along similar lines, a lot of something that they just didn’t have. But no one knew this yet, not really.

    This small series of graphics probably served two purposes: one was to alert English readers that such an invasion was theoretically possible, and secondly, that, well, it was in some ways impossible, given the enormity of the task. So, beware, but do not fear, is what I think the message was here.  

    And by the way here are two bits of films about a successful Nazi invasion of England: 

    It Happened Here, 1966:


  • “Helpless United States”, 1915

    JF Ptak Science Books   Quick Post

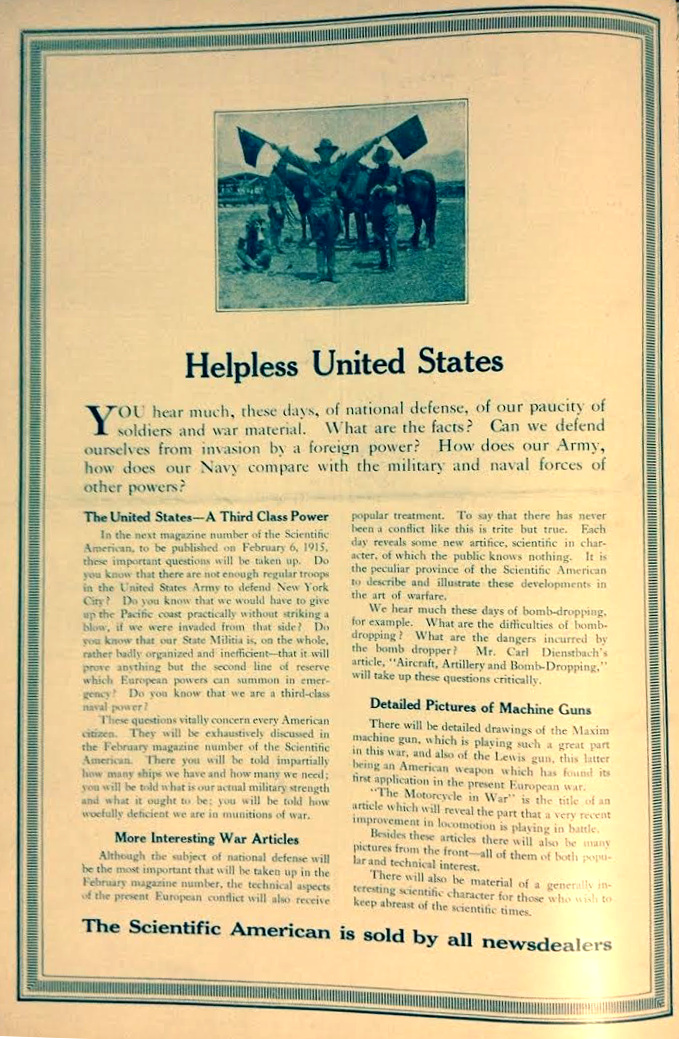
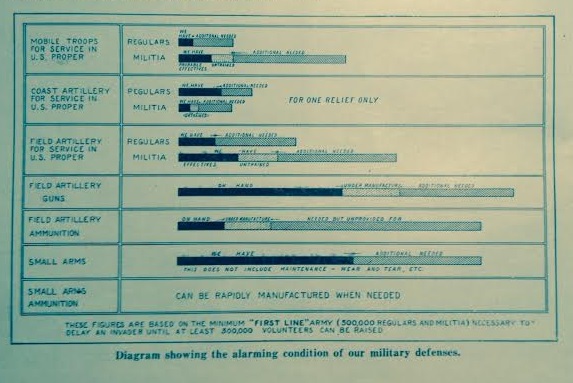
    In January, 1915, in the  pre-Luistania/post beginning of WWI (by six months) days, Scientific American declared an interest in the state of the United States military and found it lacking. It posted this very strong statement to advertise a coming special issue investigating the status of the armed services.  

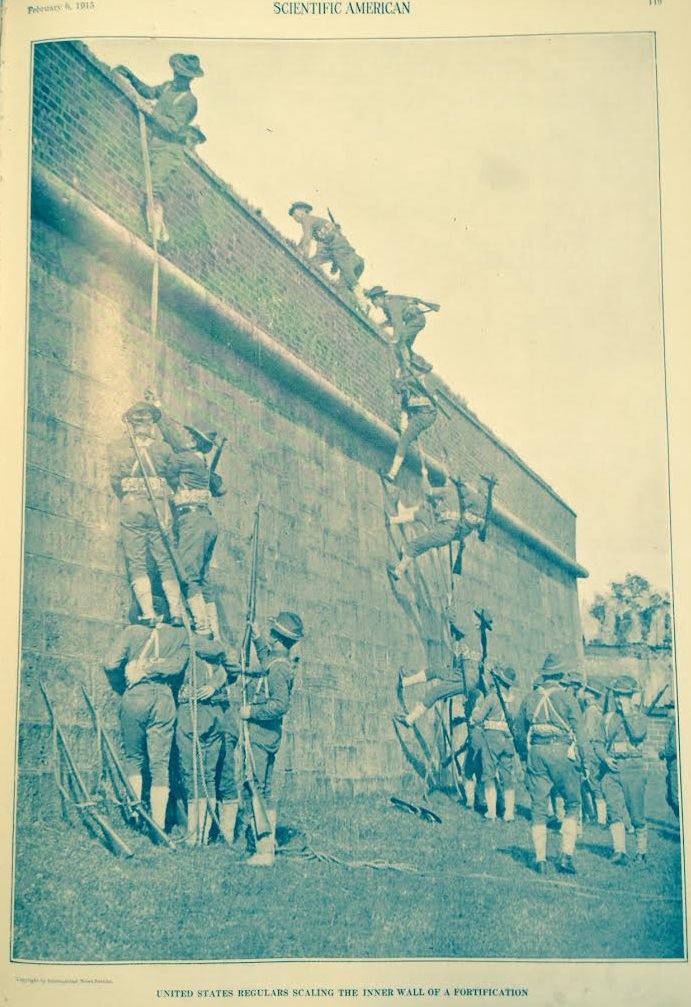
    Perhaps the most telling image in that special issue (of 5 February 1915) was an image of soldiers scaling a fortress wall–that’s pretty much the polar opposite of what training should have been happening, what with trench warfare and all.  There is also a photograph of practicing cavalry–and not a hint of a tank. There was little or no attention being paid to the developments in aerial/gas/tank/trench warfare, the armaments and munitions of war were ancient-esque, and the standing army numbered around 100,000 (plus 120k in National Guard), which was hardly anything at all compared to the fact the French Army on a single day (August 22, 1914)  in the Alsace-Lorraine region lost 27,000 dead and 40,000 wounded, and that there were already 3 million dead/wounded in the European theater.  There would be readiness factions and peace factions at work for the heart and mind of the U.S., but that wouldn’t really start for another month or two.  In the meantime, though, Scientific American took stock of the military situation, and found that the U.S. was militarily-prepared for almost nothing, so far as global war was concerned.  

    Helpless U.S.


    An indicator of the state of affairs:  

    WWI Army 1915 fortress

    WWi US army 1915


  • The Future of Oil in 1921

    JF Ptak Science Books   Quick Post

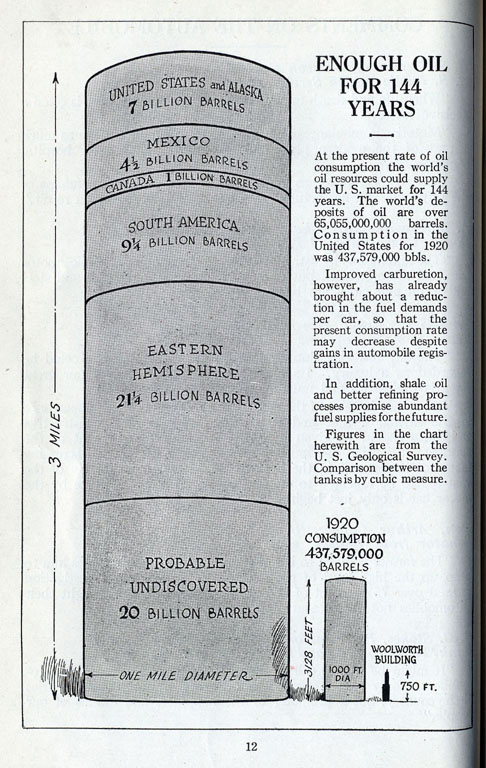
    Oil production

    [Image source:http://www.railsandtrails.com/AutoFacts/1921p12-100-8.jpg]

    There wasn’t that much of a comparative draw on what was supposed to be the world’s total supply of oil, assumed to fill a barrel about 3×1 miles, or 65 billion barrels.  (Also I assume that they are talking about oil oil, total oil, not some derivative of crude/natural/refined petroleum products and so on.) That was supposed to be enough for 140 years at the  level of consumption, about 65 billion barrels, which sounds like a lot when you drinking up 500 million/year. And it should be noted that this was for U.S. consumption only–I don’t know what happened to the rest of the world on this one; probably it was a failure of gathering statistics rather than a myopic America-only viewpoint.

    But that was 1921, and there is no mention of the Middle East (which wouldn’t become a player for a few decades) and other oil-rich regions, and other factors too numerous to mention in this quick post, so it was very much a prediction of the moment more so than of the future. The other very problematic issue with the graph is assuming the “current rate of consumption”, which would absolutely and totally miss the explosion of oil-consuming vehicles and the production of pretroleum-inclusive products.  The bottom line is that in 2013 the total world production of all aspects of oil was about 32 billion barrels1, or half of what was thought to be the total world reserves of oil in 1921.    

    Footnotes

    1. U.S. Energy Information Administration, http://www.eia.gov/cfapps/ipdbproject/IEDIndex3.cfm?tid=5&pid=53&aid=1


  • Measuring Things with Mountains & the German Big Gun of WWI (1918)

    JF Ptak Science Books  Quick Post

    The story of the (very) long-range bombardment of Paris from points unknown is filled with questions in this article that appeared in the Scientific American on April 6, 1918.  The writer hadn’t an idea of the type of gun being used, the weight of the shell (yet), and just about all other details.  The author did wonder about the reasons for such a gun–that the idea of a long-range indescrimient bombing from a great distance just seemed to be beyond the wanting capacity of the countries fighting Germany.  

    The big gun was The Big Gun, later identified as the Paris Gun–a mysterious entity during the war, and after the war as well.  It turns out that when the Germany army retreated beginning in August that they also destroyed the weapon and just about anything connected to it.

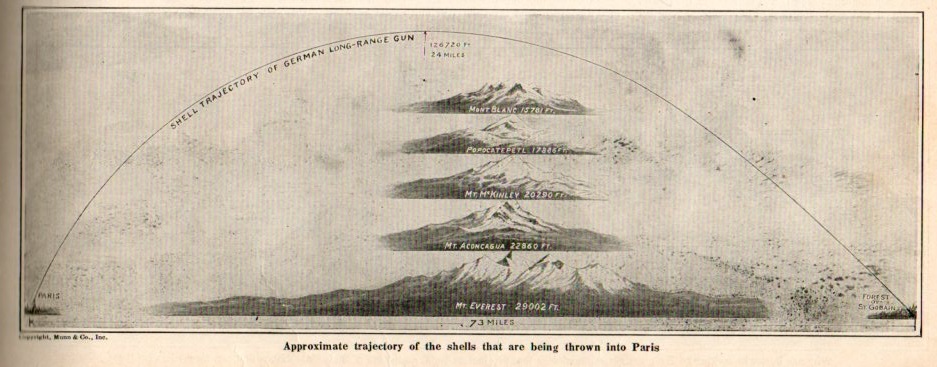
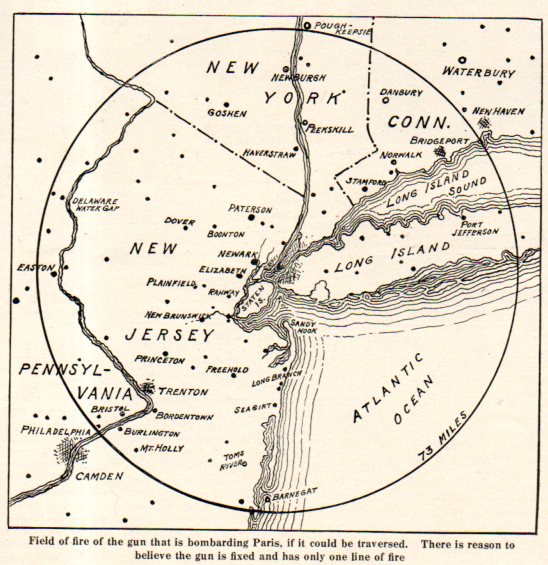
    The gun was extremely powerful.  At 256 tons it launched a 236-pound shell to a height never before achieved by humans launching/propelling stuff into the air–it left the barrel of the gun at about 1 mile/second, traveled 75 overland miles, reached a height of 26 miles…and then came down, exploding, killing.

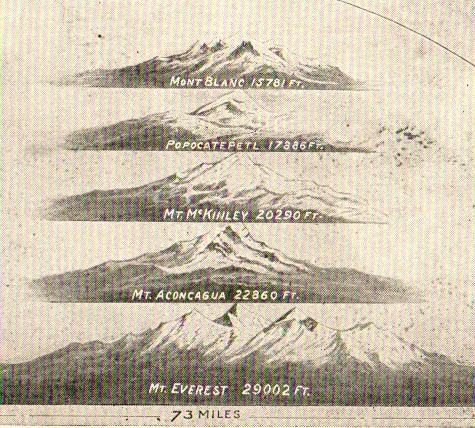
    One very effective way of explaining the incredible height that the shell reached was measuring the zenith of its trajectory in terms of mountains:

    WWI--german gun569

    Which is a detail from:

    WWI--german gun568

    And to give a more local understanding of the range of the gun:

    WWI--german gun567No doubt this map gave a true flavor and sense of dread to American readers on exactly what it meant to have to deal with a cannon whose reach was 75+ miles. 


  • Interesting Graphic: German Military Forces, 1929

    JF Ptak Science Books  Quick Post

    Graphic Army strength 1929551

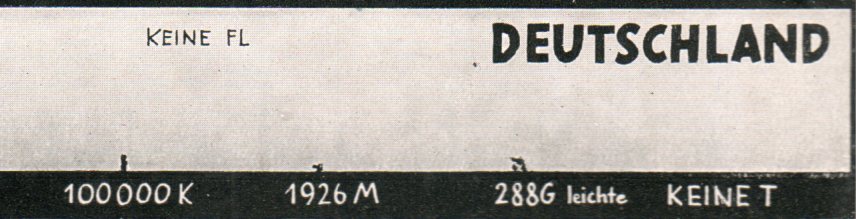
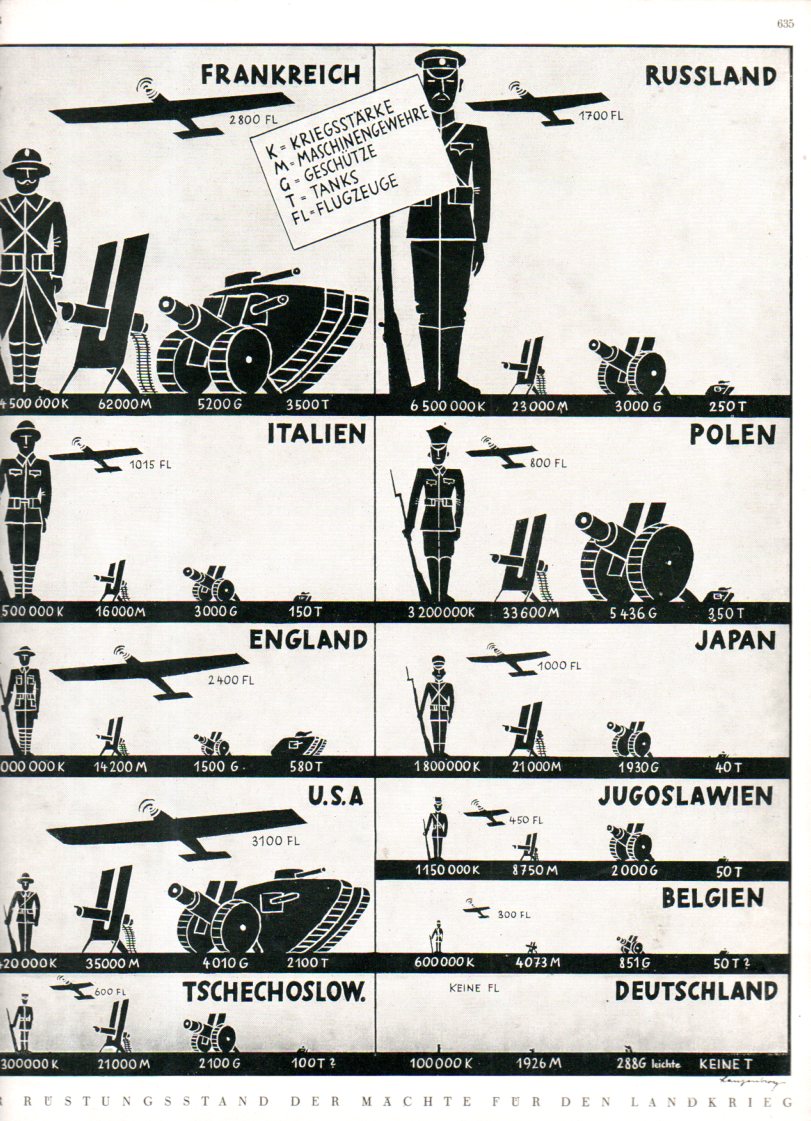
    This is for issue #4523, August, 1929 of the Illustrirte Zeitung (Leipzig), “Der Rustungsstand der Machte fur den Landkrieg”, which showed the comparative strengths of leading nations against that of Germany.  As seen in the detail, in 1929 Germany was still abiding by the Treaty of Versailles, which was the peace treaty ending WWI and signed in 1919. The 440-clause treaty spent the first two dozen or so clauses discussing the creation of President Wilson’s League of Nations, while the rest was a distribution of punishment and reparations against/on Germany.  The German military as directed by Versailles was limited to 100,000 soldiers, and had 1926 machine guns, and 2886 cannons.  as stipulated Germany could have no tanks and no air force, and was limited to six ships and no subs, and had to keep the Rhineland free of all armed forces.  This would all be completely changed by 1934, when the Nazis were already well on the way to having a competitive (and modern) fighting force which counted 4.5 million troops.  It would only get worse.  

    Graphic Army strength 1929550


  • Interesting Graphic Display for Aircraft Losses, 1917

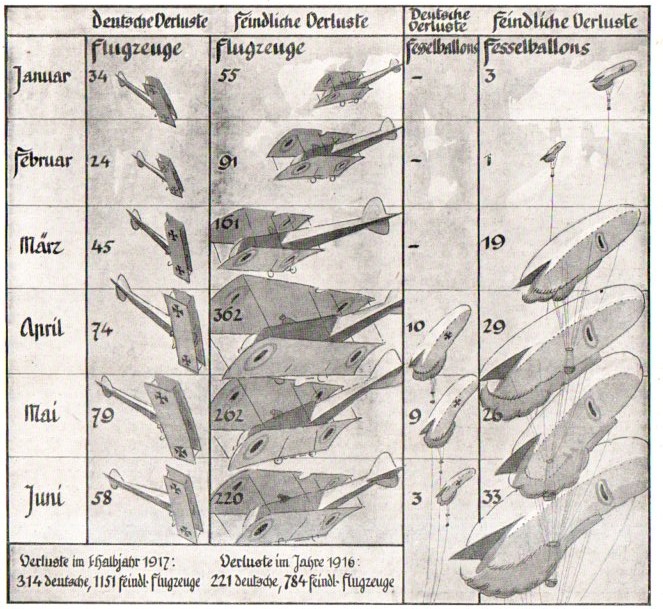
    JF Ptak Science Books   Quick PostGraphic aircraft losses 1917548

    This interesting graphic came in a browsing expedition in the July-December 1917 volume of the (Leipzig) Illustrirte Zeitung.  It appeared in the issue #3865 for July 17, 1917, in an article “Fliegererlebnisse” (“Aviation/Flying Experiences”) by Adolf Victor von Koerper. (Koerper was a very interesting man–aviator, early upper-echelon supporter of Adolf Hitler 1922-1926, and then accused and convicted and sentenced-to-death Hitler assassination conspirator.)  The chart shows the success of the German air force against the “Feindliche” (“Hostile”) aircraft, depicting losses (“verluste”) in airplanes and war balloons (“fesselballons”), for January-June, 1917.  According to this German losses were set at 314 aircraft and Allied forces at 1151, with a very high loss rate for (“Bloody”) April.