A Daily History of Holes, Dots, Lines, Science, History, Math, Physics, Art, the Unintentional Absurd, Architecture, Maps, Data Visualization, Blank and Missing Things, and so on. |1.6 million words, 7500 images, 4.9 million hits| Press & appearances in The Times, Le Figaro, Mensa, The Economist, The Guardian, Discovery News, Slate, Le Monde, Sci American Blogs, Le Pont, and many other places… 5000+ total posts since 2008.

Category: Information, Quantitative Display of

  • Maps Showing Rates of Travel

    JF Ptak Science Books  Quick Post

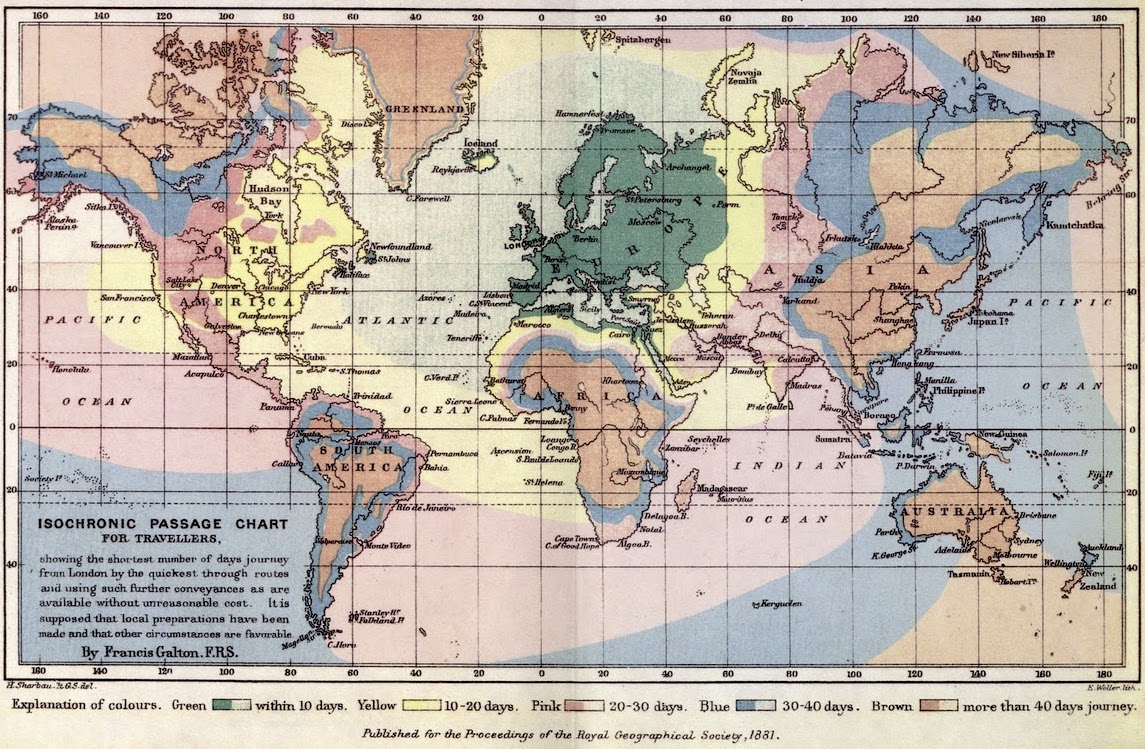
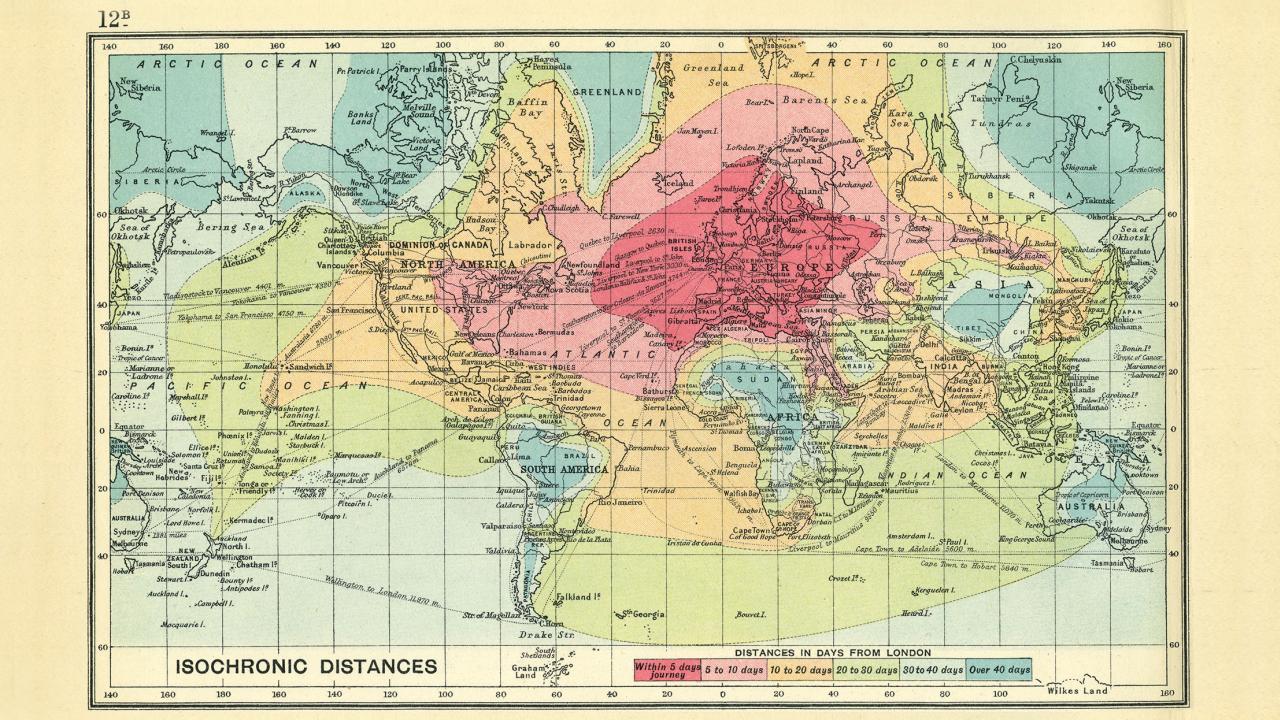
    This morning the writer Clifton Wiens alerted me to his friend’s blog Fevered Mutterings where I found the article “How Fast Do You Want to Get There?” which was illustrated with two fine early isochrone maps. The isochrone/isochronic map is a map of time travel, depicting how long it would take to reach different places from a central point, the variants detailed in colors. (For the record they all seem to assume good or normal or scheduled arrivals and departures, good weather, no impudent problems…so you probably would have to calculate for longer times, given the nature of the beast in the 19th/early 20th century.) In any event, I wanted to reproduce them here along with others that I find. 

    The first of the maps is probably the first of the isochrones, made by the very-multiply-talented Francis Galton. It appeared in 1881(and then again in 1882) in “On the Construction of Isochronic Passage Charts” in the  Proceedings of the Royal Geographical Society (Royal Geographical Society) page 657.
     

    Maps isochronic galton 1881[Source: http://feveredmutterings.com/fast-travel]


    The next example is by John G. Batholomew with his Isochronic Distance Map and Chart which was first published 1889 (and then again in 1914) in his  Atlas of Commercial Geography  or earlier
    Maps isochronic 1914

    [http://feveredmutterings.com/fast-travel]

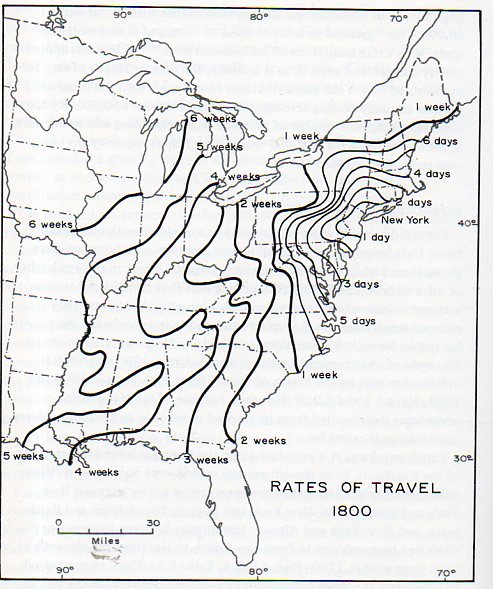
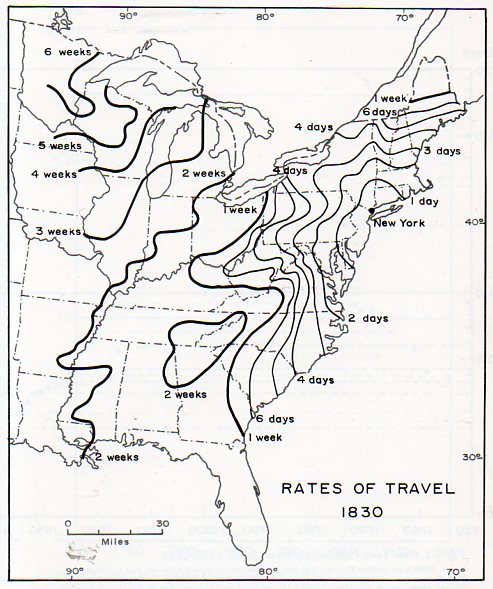
    The following maps are not quite the same, being historical and retroactive, and show rates of travel in the U.S. over certain decades (and seen earlier in this blog in the post “Time Travel in the Early U.S., 1800-1857” https://historyofideasblog.com/thesciencebookstore/2012/02/travel-time-in-the-young-republic-1800-1830.html: 
    Travel time 1317

    [Source: Allan R. Pred Urban Growth and the Circulation of Information, 1790-1840 (Harvard, 1973)]
    Travel time 2316


    [Source: Allan R. Pred Urban Growth and the Circulation of Information, 1790-1840 (Harvard, 1973)]

    Sources and Notes

    Another good collection of modern isochrones can be found here: http://www.citymetric.com/transport/its-christmas-so-here-are-11-beautiful-isochrone-maps-showing-travel-times-different

    Another view of the Allan Pred maps can be found here: Michael Graham Richaard,  “How fast could you travel across the U.S. in the 1800s?” http://www.mnn.com/green-tech/transportation/stories/how-fast-could-you-travel-across-the-us-in-the-1800s

    Also, another older map is by Albrecht Penk’s  “Isochronenkarte” first published 1887  “Isochronenkarte der österreichisch-ungarischen Monarchie”. Deutsche Rundschau für Geographie und Statistik: 337

    https://www.1843magazine.com/places/cartophilia/time-travel   1914 map

    The Galton map is also found here: https://upload.wikimedia.org/wikipedia/commons/8/86/Isochronic_Passage_Chart_Francis_Galton_1881.jpg


  • Glorious Astronomical Gearworks

    Glorious Gearworks, Extended–Models of the Solar System, 1817-1821

    JF Ptak Science Books  Quick Post

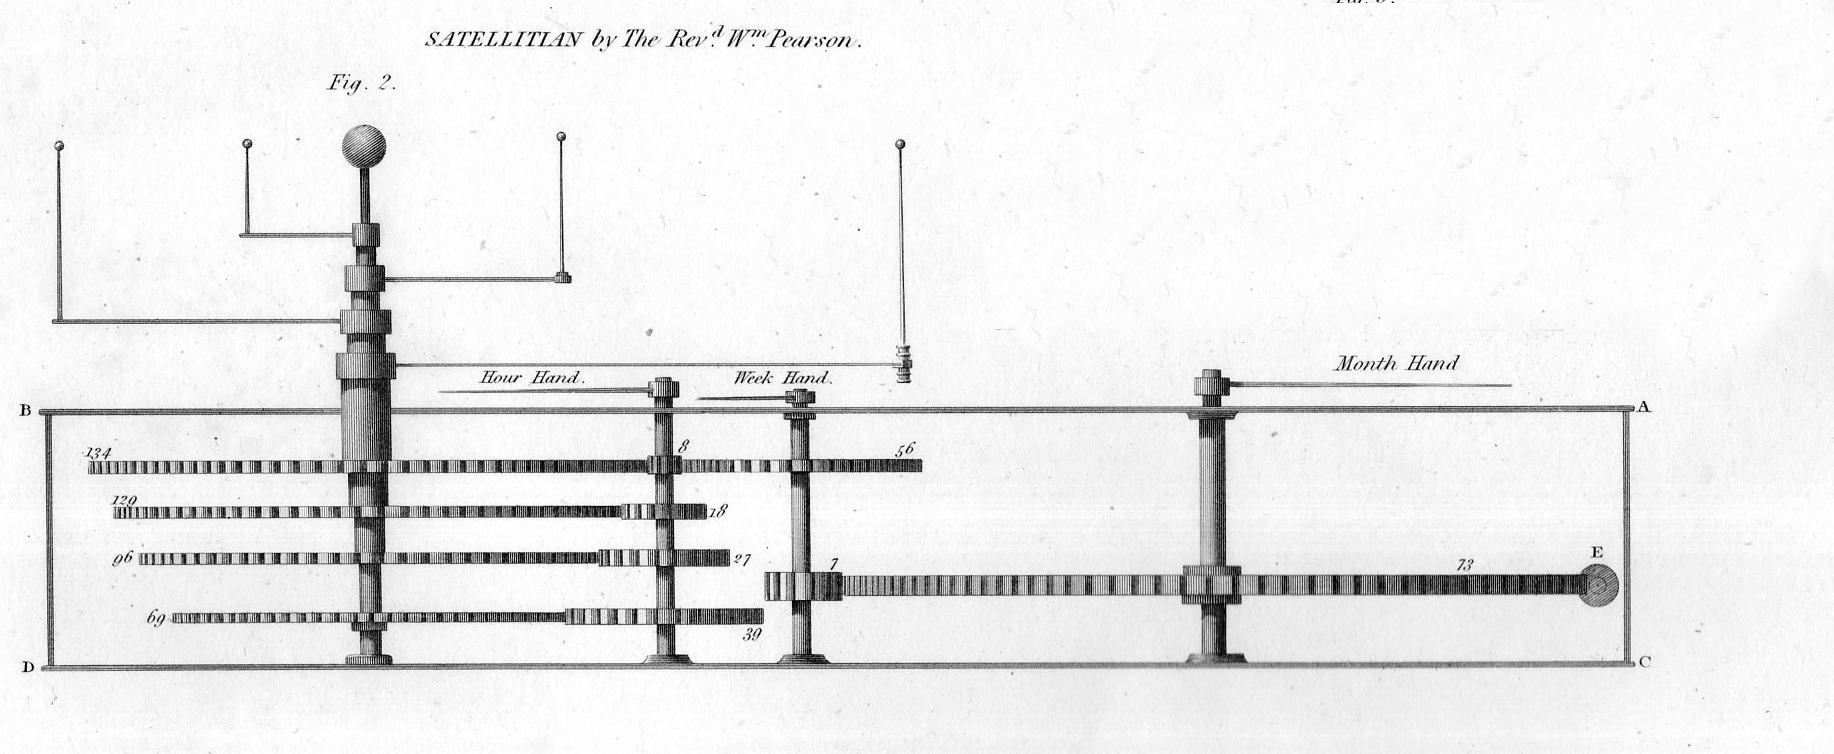
    I’d like to make a quick addition to an earlier post on a form of  Pearson’s planetarium.  This is from the same source, though from a few years later, and involves Pearson’s Satellitian, which was a differently-abled device.  All of the images appeared in the magisterial if not occasionally problematic Cyclopedia of Abraham Rees (1743-1825).

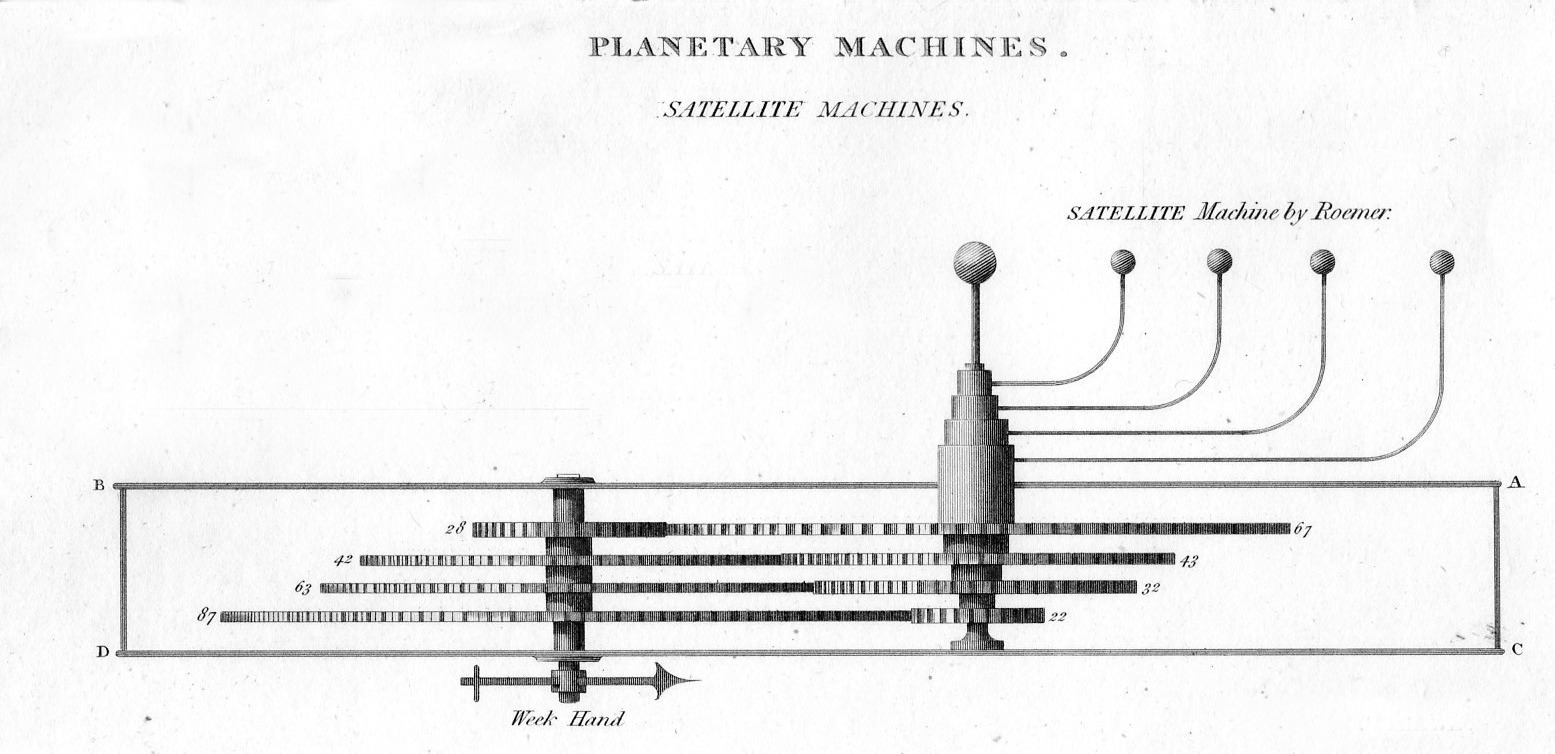
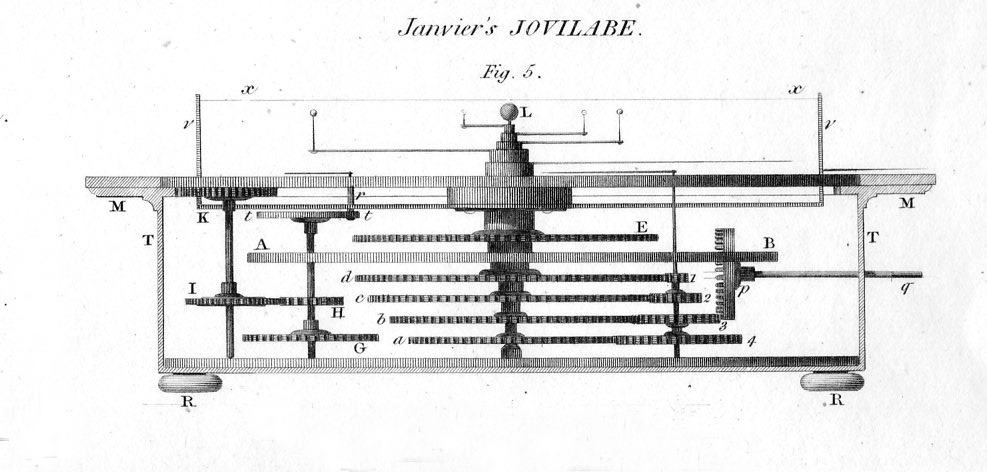
    The first image is a cross section for he “Satellite Machine by Roemer”, followed by “Janvier’s Jovilabe, and the with Willliam Pearson’s “Satellitian”, all appearing on the same 11×8″ sheet and printed in 1820.

    First, the Roemer:

    Planetary MAchine Roemer

    Here’s a description from Rees on the Roemer instrument (this courtesy of Google Books; the images are my own):

    • A good article on the Roemer and the Pearson machines appears in the Edinburgh Magazine, volume 15, 1832,  http://tinyurl.com/ogo36n9 

     And the Janvier:

    Planetary MAchine jANVIERb

    And the Pearson machine:

    Planetary MAchine Pearson

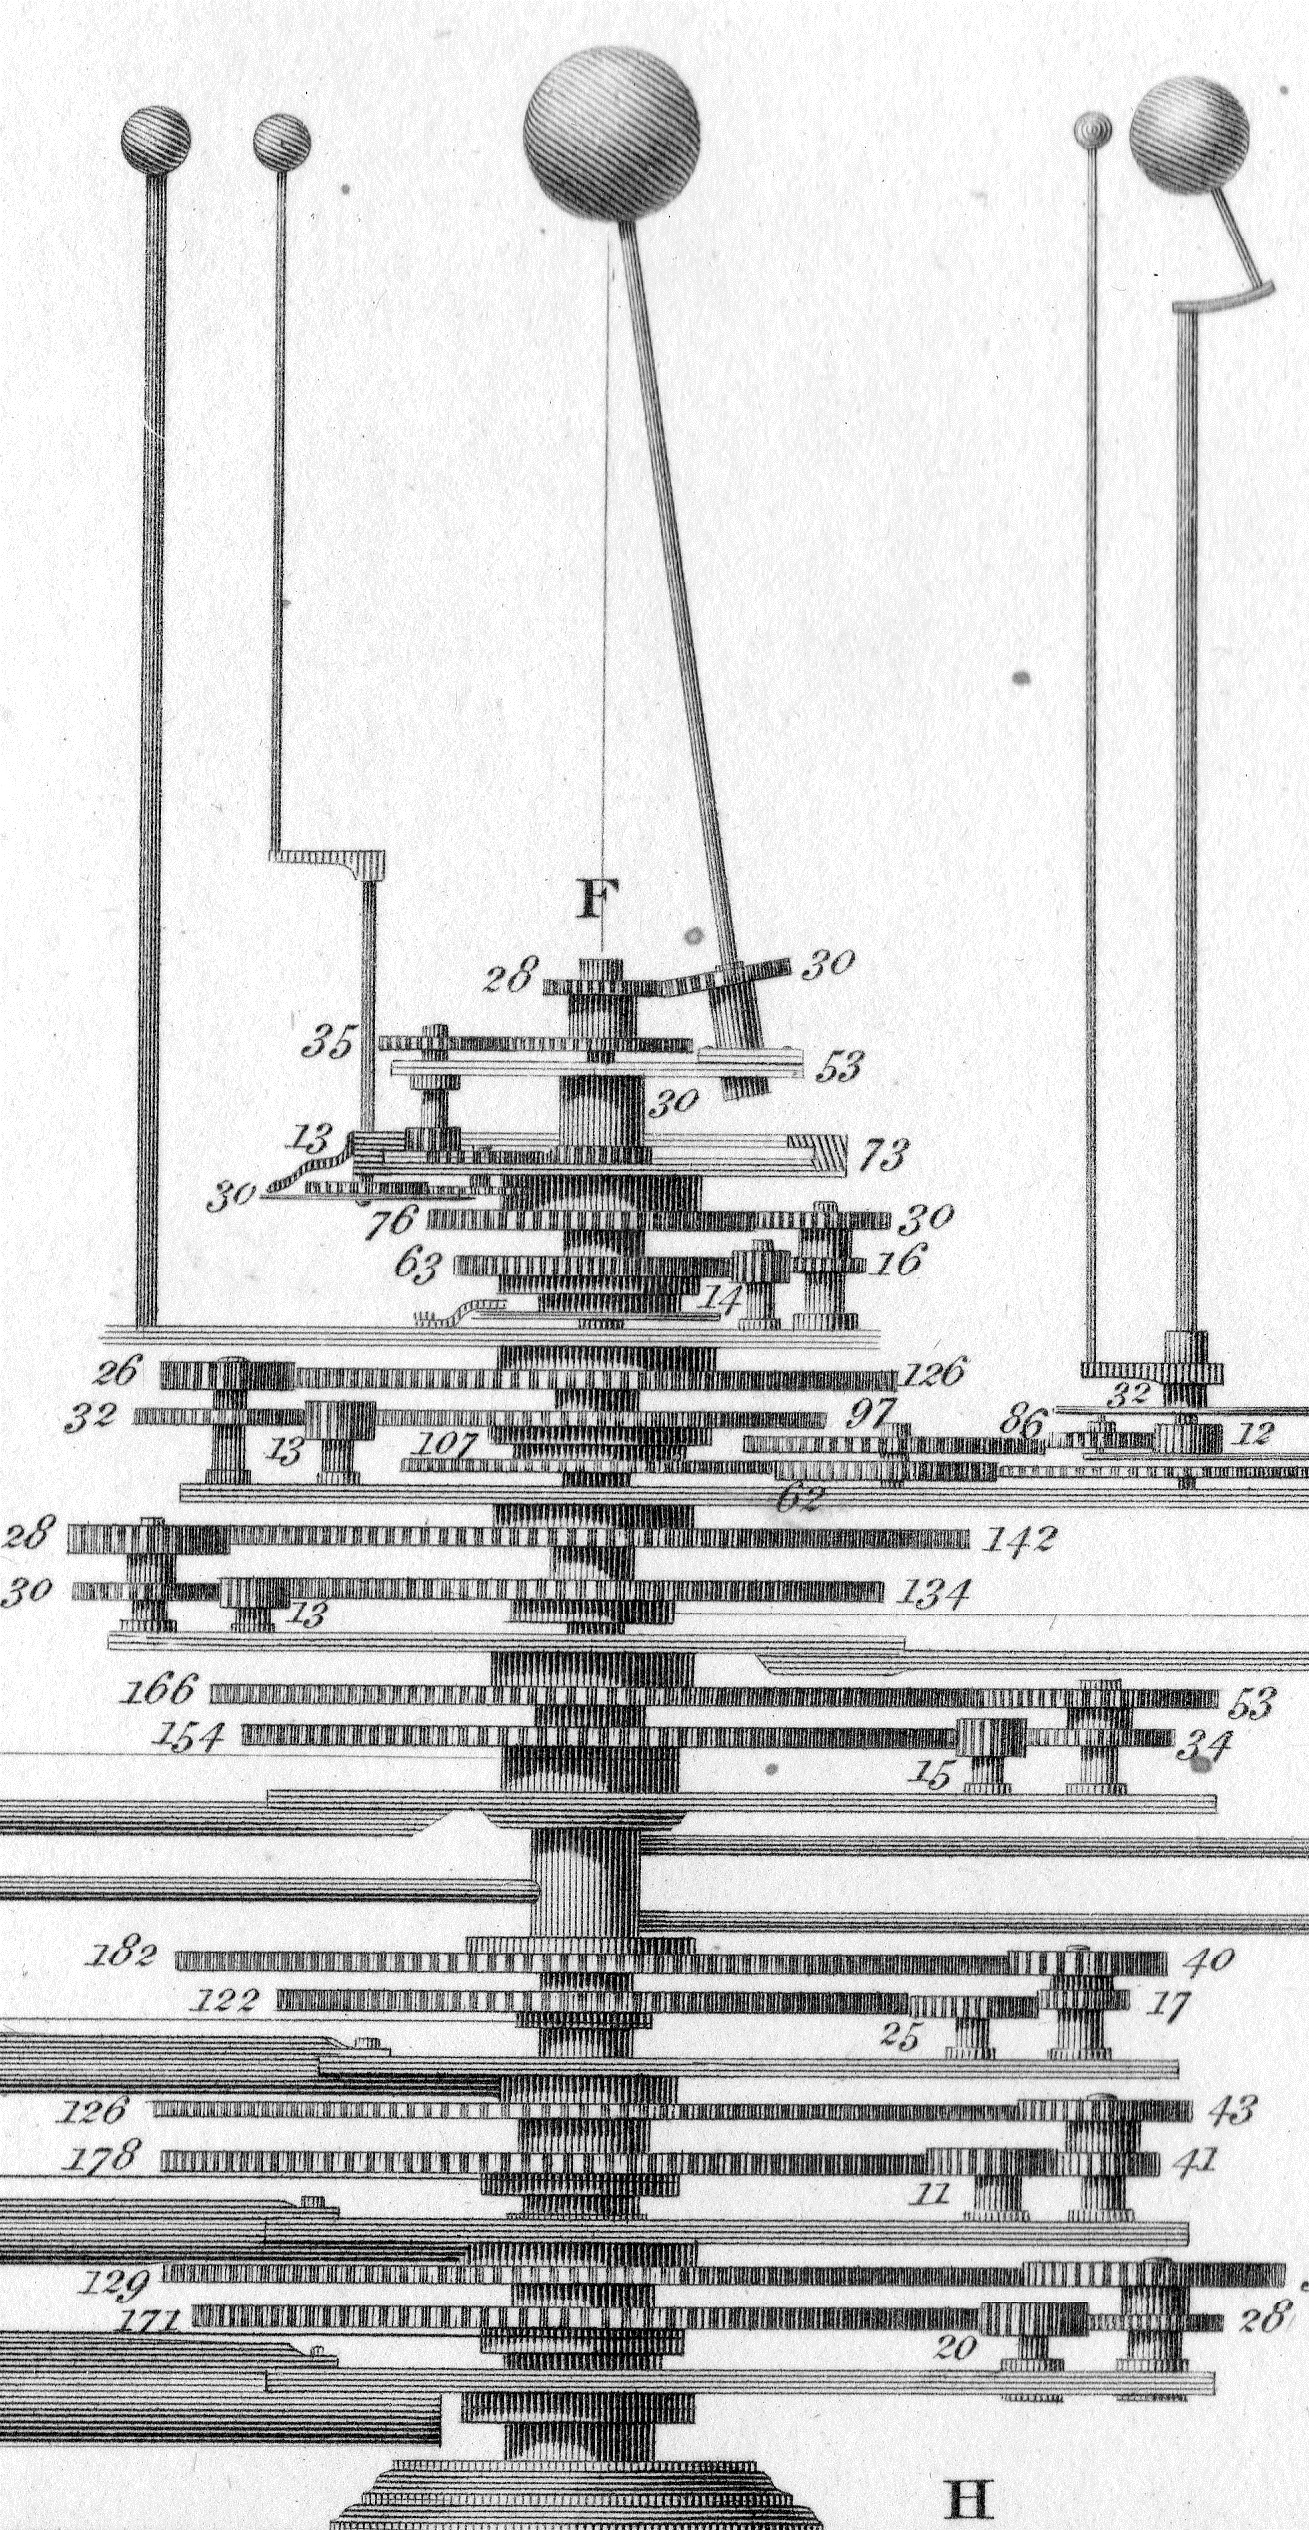
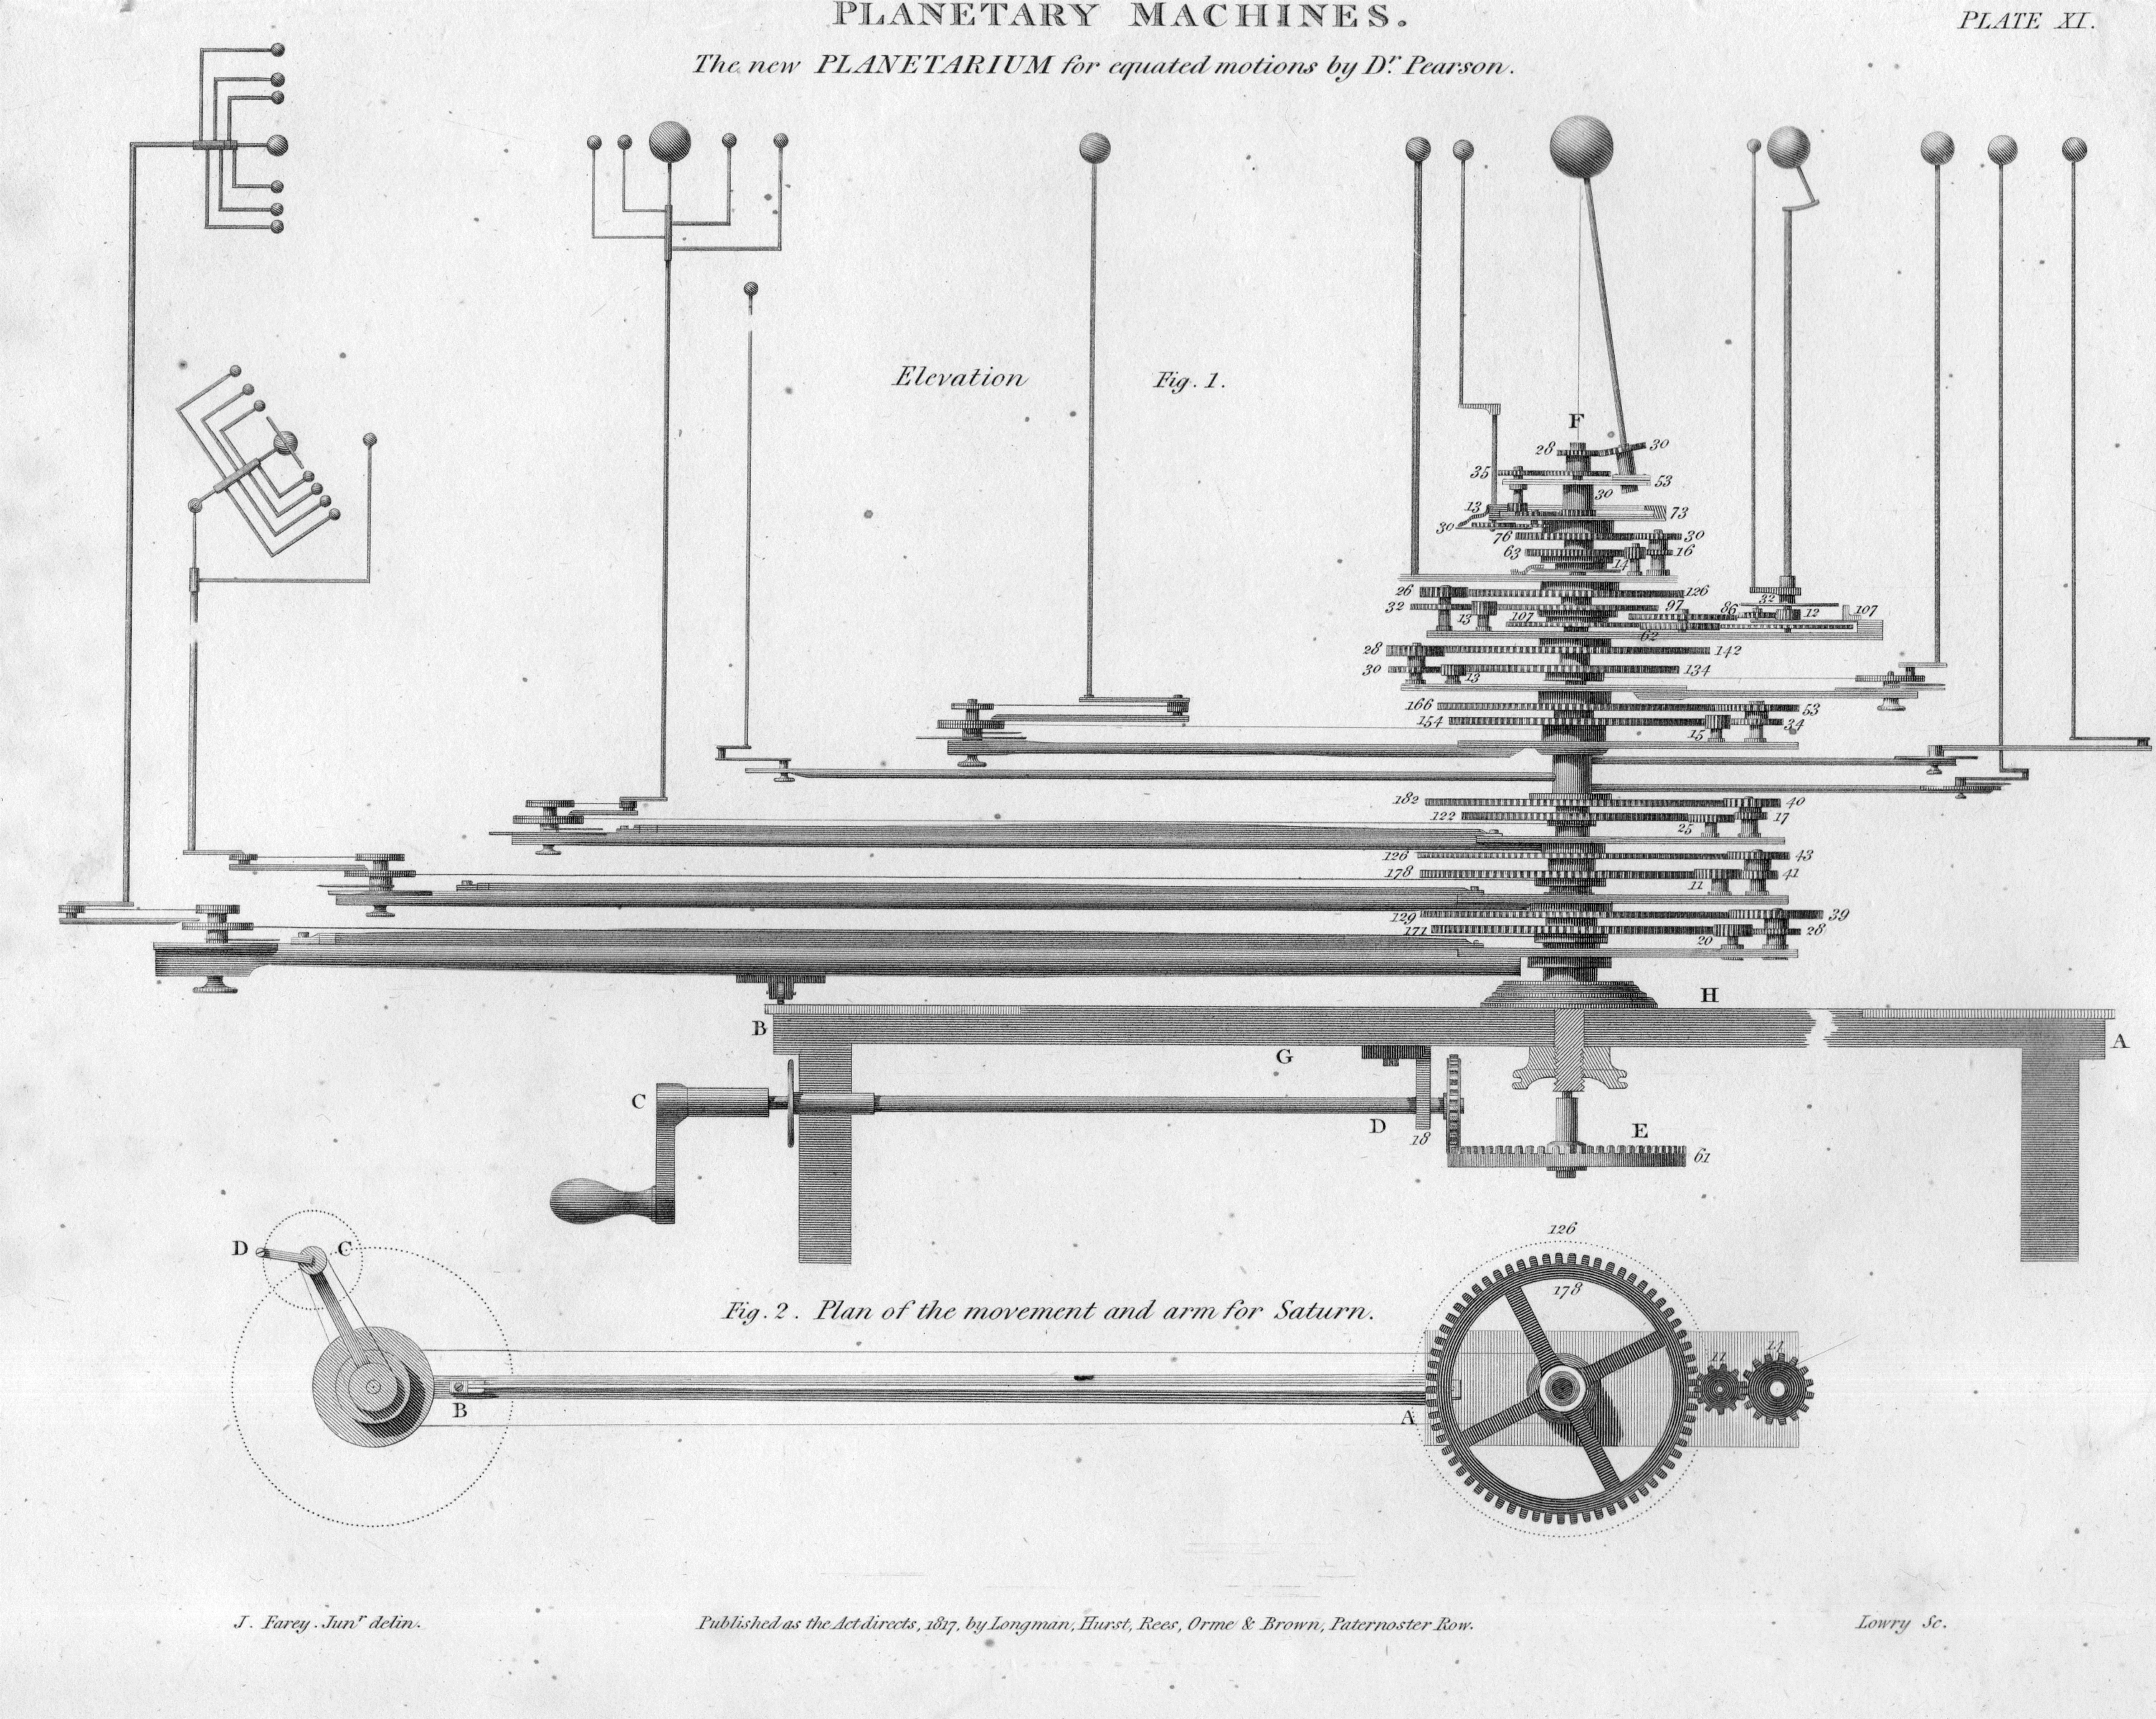
    This is the second Pearson instrument, the heart of  a beautiful orrey created by William Pearson (1767-1847, and one of the founders of the Royal Astronomical Society) as found in the 1817 volume of Rees, and features the main gearing for a mechanical display of the functioning of the Solar System:

    Planetarium916

    This is the detail from the following, full-length version, which is 8″x10″–so there’s a fair amount of detail in a limited field:

    Planetarium914

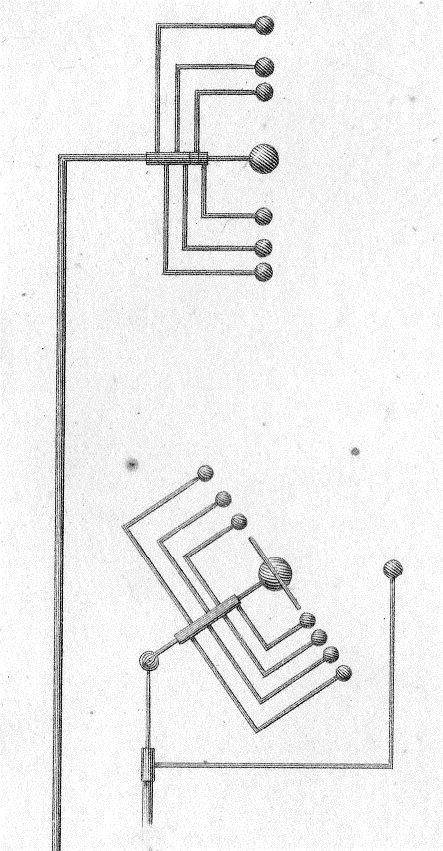
    And the beautiful Dadaist detail of Jupiter and Saturn:

    Planetarium915


  • German Aircraft Losses During WWII

    JF Ptak Science Books  Quick Post1000 Nazi aircraft

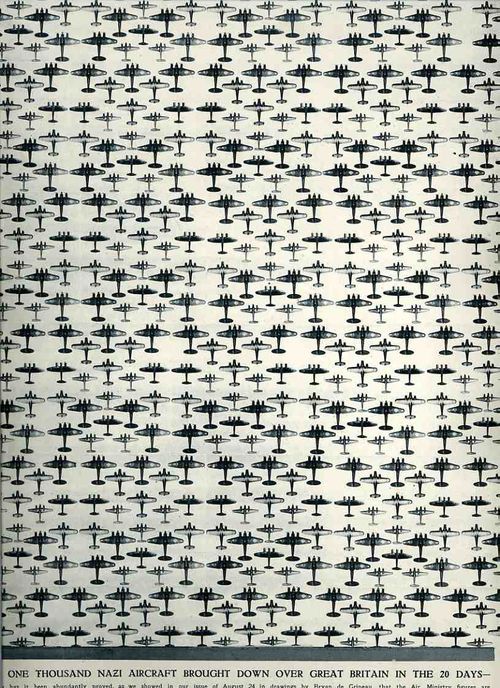
    The marks in each of the squares below represents one aircraft–and as a matter of fact if you click on one of the 25-square squares you will be able to zoom in and see the detail, which is basically missing at this level.   Germany lost (meaning destroyed or damaged beyond repair) “76,875 aircraft, of which 40,000 were total losses and the remainder significantly damaged. By type, losses totaled 21,452 fighters, 12,037 bombers, 15,428 trainers, 10,221 twin-engine fighters, 5,548 ground attack, 6,733 reconnaissance, and 6,141 transports” (According to the “Equipment Losses” for WWII on Wiki.)  The aircraft graphic uses images of German aircraft–I would much rather have display U.S. and/or U.K. aircraft losses, but that could not be done using the German plane images. (The U.K. lost more than 42,000 planes, and the U.S. 95,000.) So for right now, we’ll just have the German graphic, the source of which is the 7 September 1940 issue of the Illustrated London News, which displayed one thousand destroyed German aircraft brought down over Great Britain in 28 days (see here):


    25,000 planes

    25,000 planes

    25,000 planes


  • Cross-sections: U.S.-Built R.A.F Fighter Aircraft, 1942

    JF Ptak Science Books   Quick Post

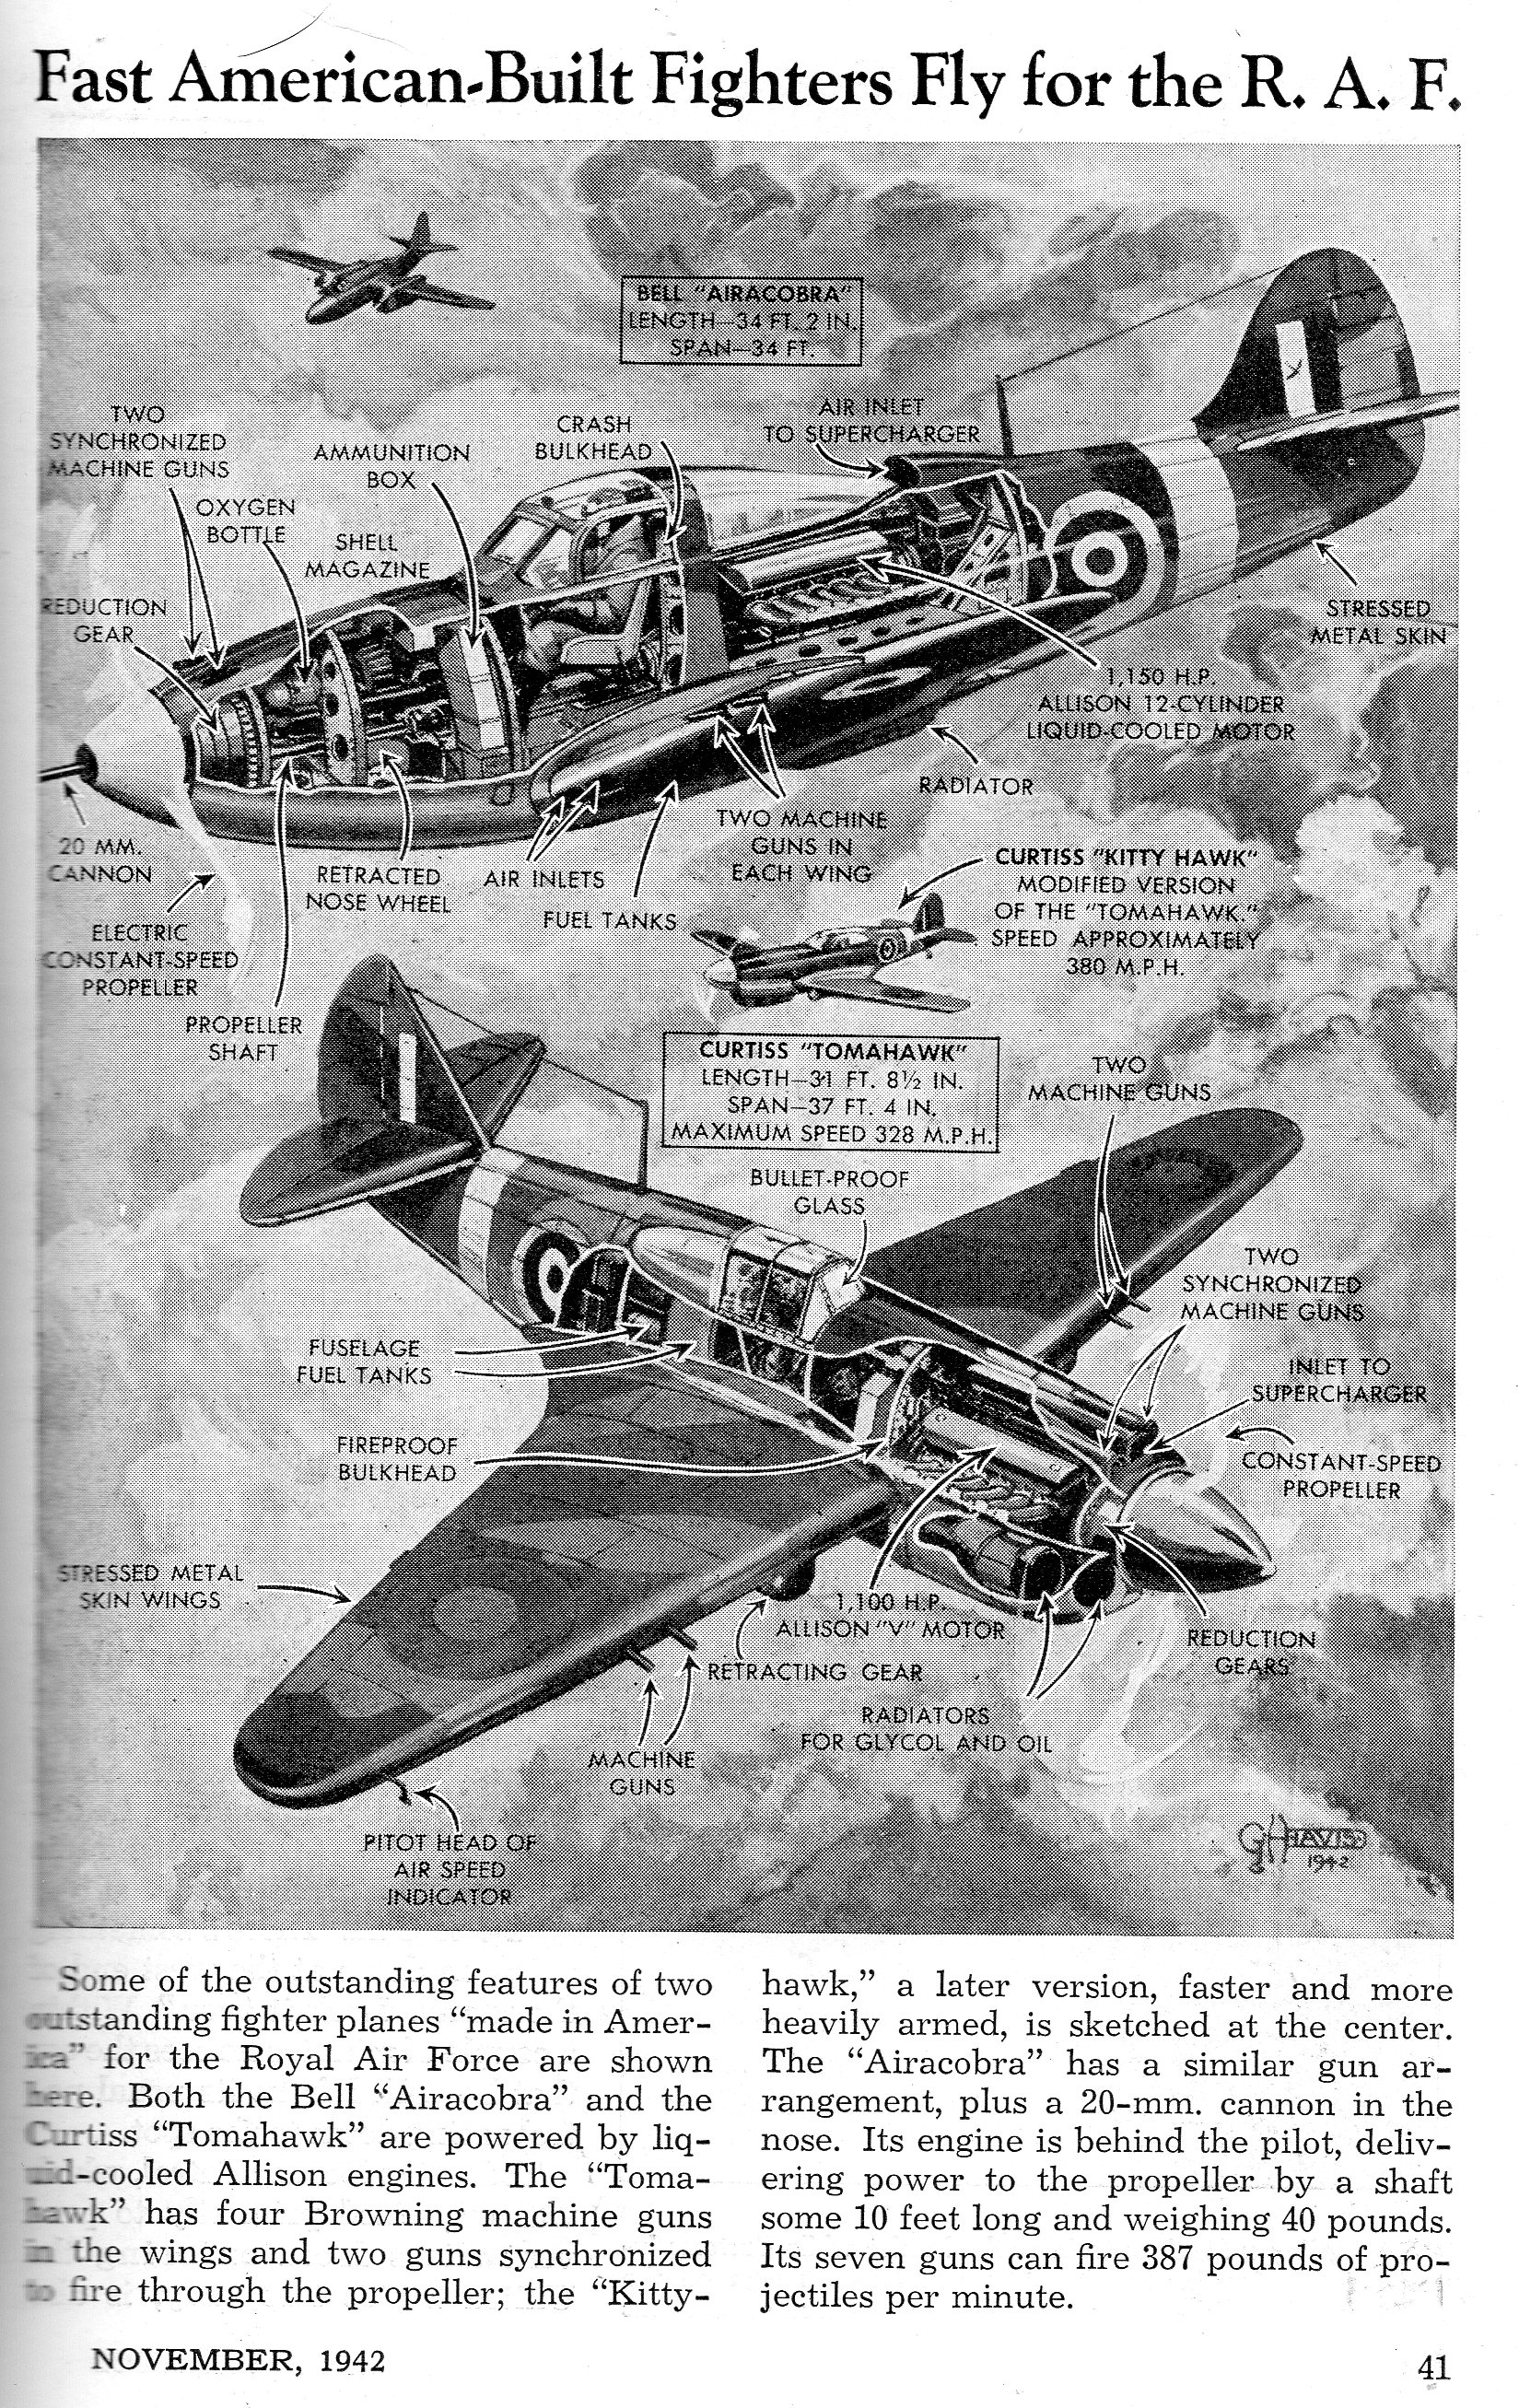
    Here’s an interesting cross section by the great and invaluable George Horace Davis, appearing in the November 1942 issue of Popular Mechanics, page 41.  I’ve noted elsewhere that Davis reminds me of Thomas Nast, in a way–his output was enormous and workmanship wonderful, seemingly publishing drawings like this every few weeks, if not more frequently, reminiscent of the fantastic production of Nast. I can only imagine that Davis was seeing most of the detail in his memory rather than referring endlessly back-and-forth to references–I don’t know that this is so, but it does make good sense.  (For other work by Davis, just enter his name in the google box for his blog appearances.)

    WWII american built fighters384


  • Artwork for Detecting Nuclear Explosions in Outer Space (1960)

    JF Ptak Science Books   Quick Post

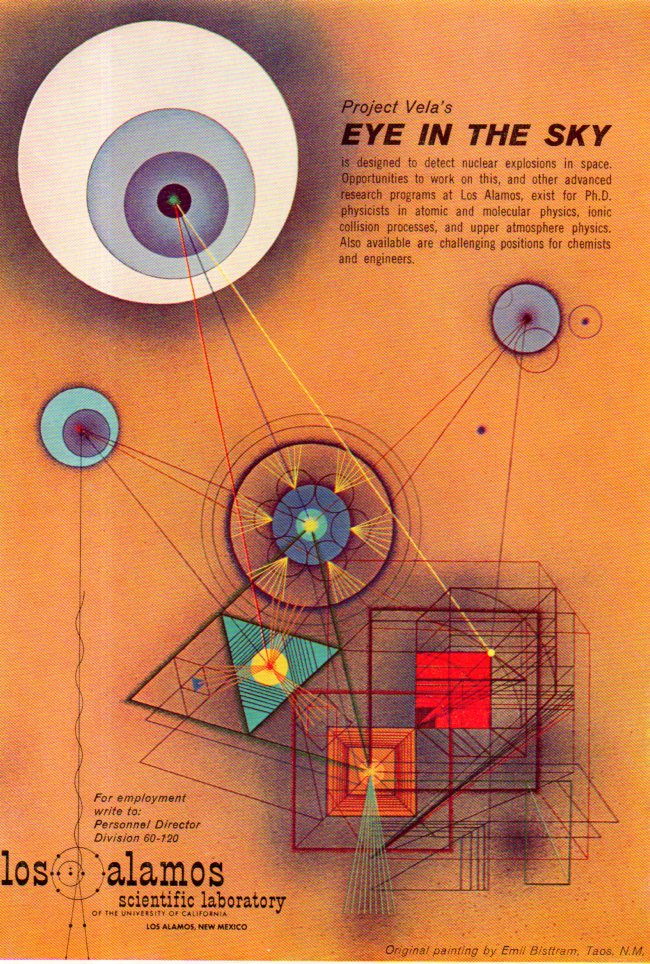
    I do not have the source for this though I believe it is from Science Magazine from 1960.  The ad was placed LANL looking for new hires, and employed the artwork of Emil Bisttram (Taos, New Mexico), representing the new ARPA (pre-DARPA) work for the detection of nuclear explosion tests conducted in outer space, Project VELA.  (“In a continuation of presidentially directed programs, Eisenhower assigned ARPA in the summer of 1959 the task of developing the technologies necessary for the detection of nuclear tests, what would become Project VELA (Vela means watchman in Spanish). This program would examine technologies for detection space and atmospheric tests by satellites (VELA , undertaken by the High Altitude Detection panel (the Panofsky panel) of PSAC, which recommended that a satellite system be employed to detect atmospheric or space nuclear tests as part of a verification system for a possible nuclear test ban treaty.”–“DARPA Space History”, here: http://qnet.me/legal/DARPA%20-%20Background.pdf

    Ads  VELA371


  • Last of the Elements Discovered: Periodic Table and Element Use (1951)

    JF Ptak Science Books   Quick Post

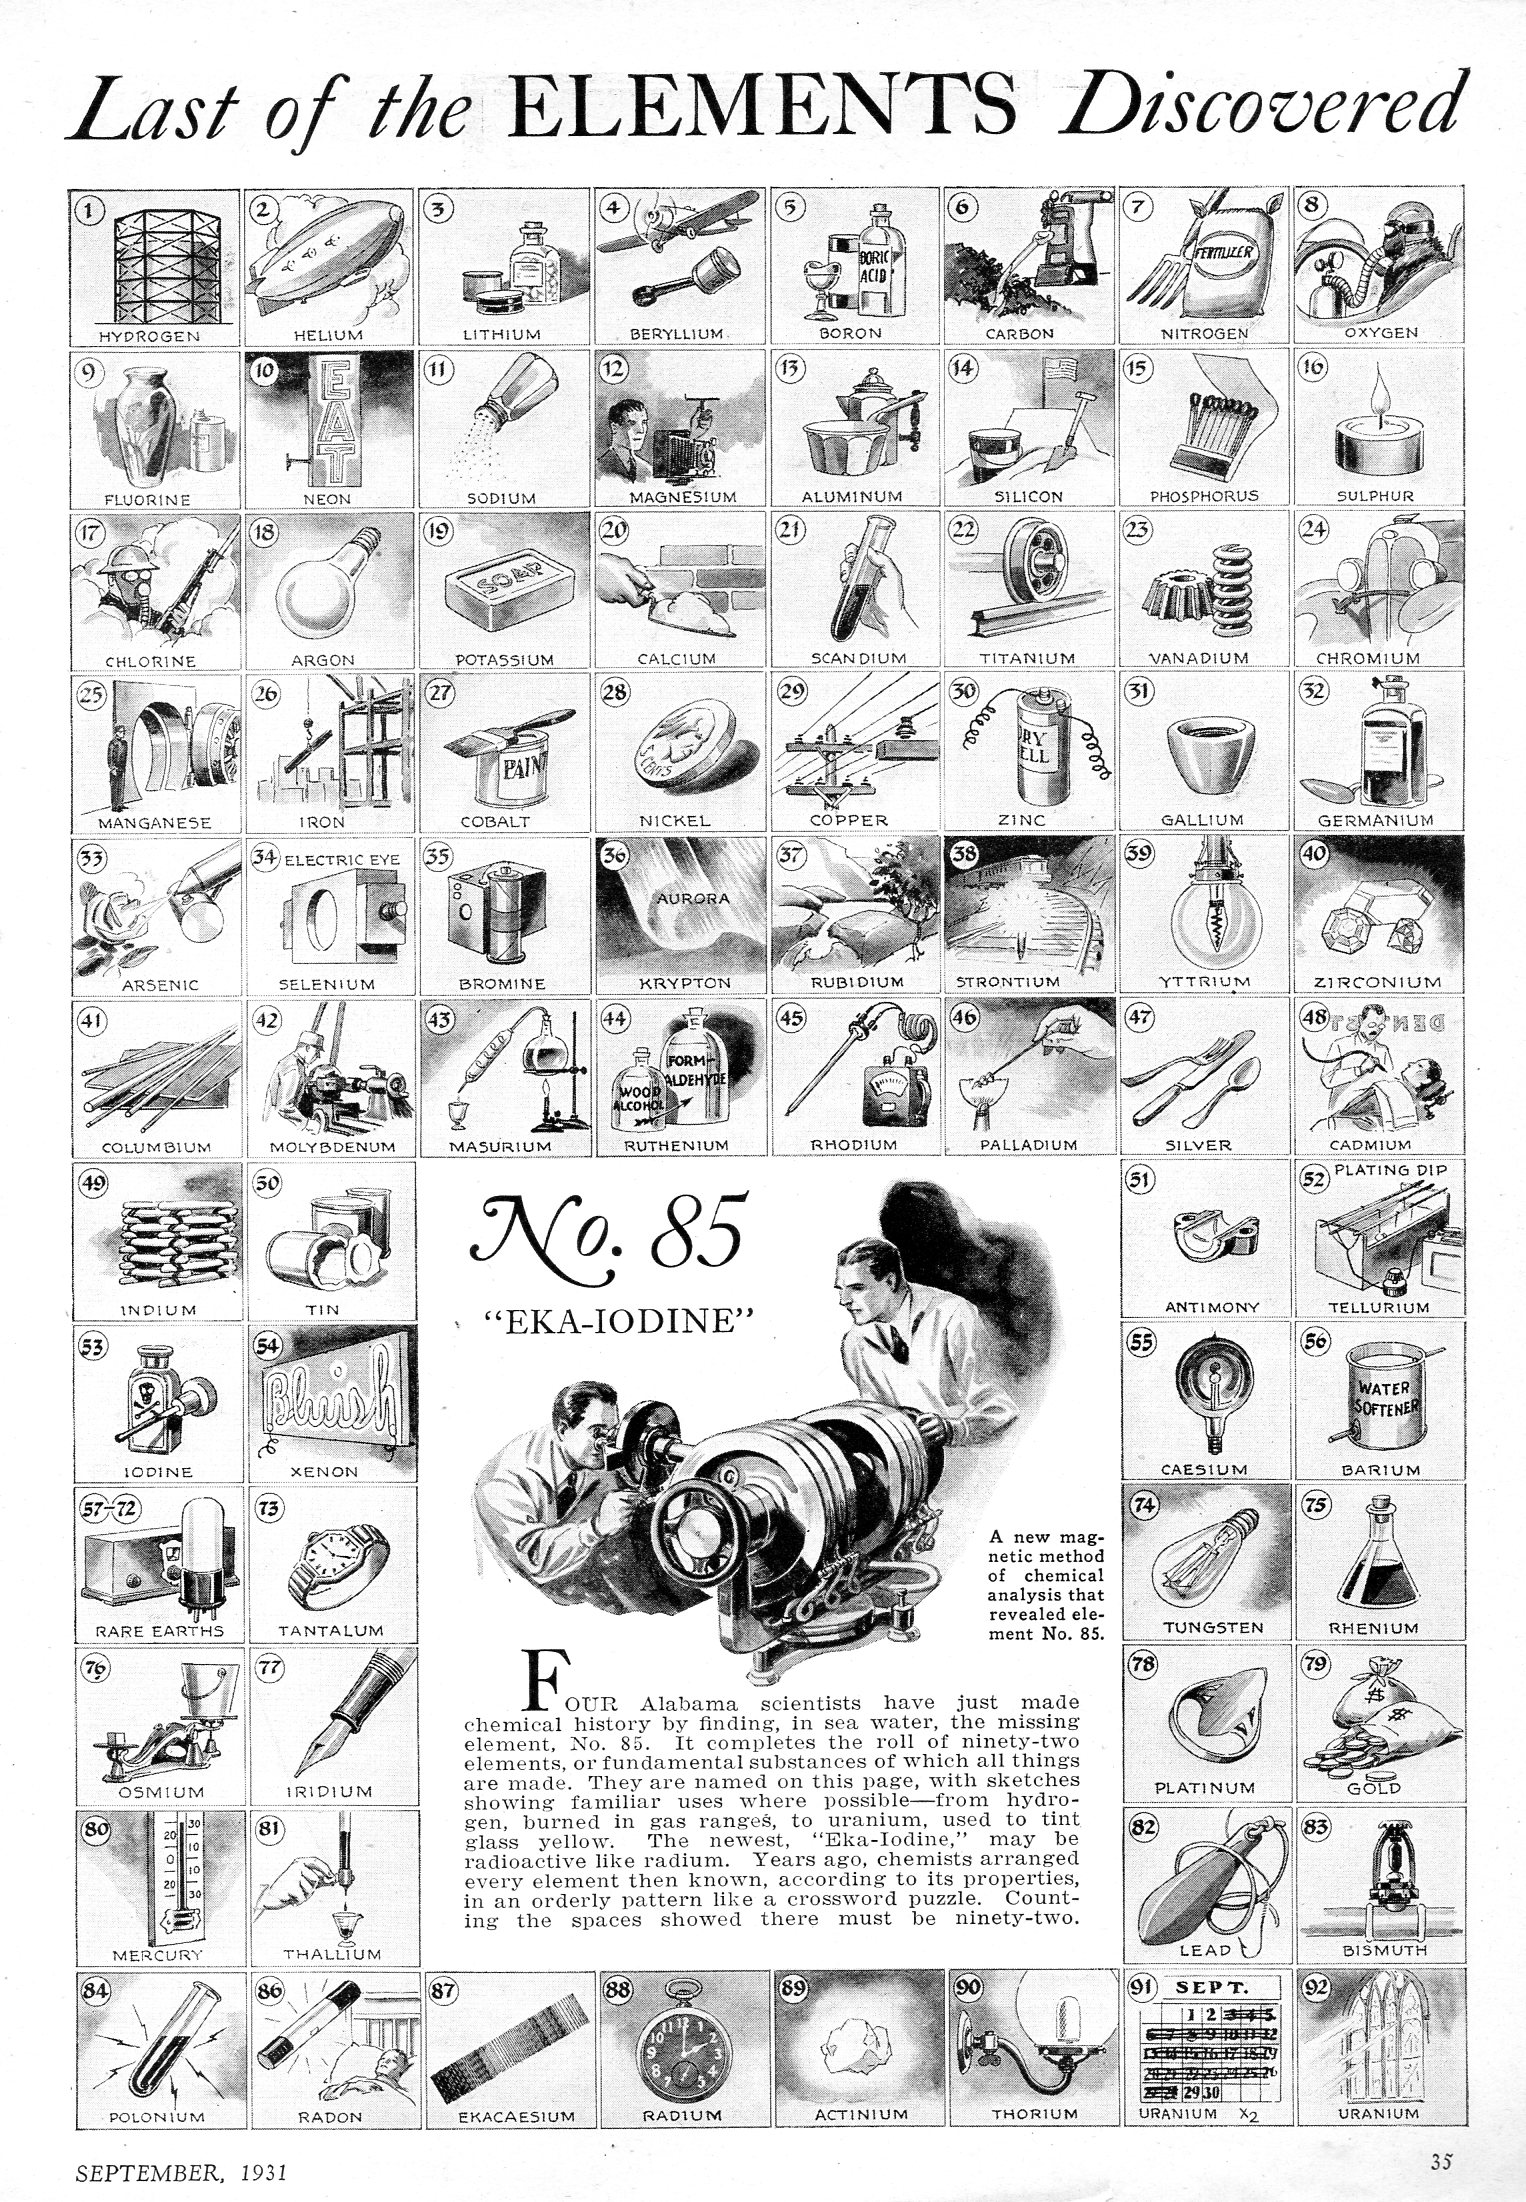
    I found this down in the warehouse this morning, published in Popular Science Monthly, September 1951.  It sin’t every day that you see a periodic table with drawings showing the employment of the elements, especially the stained glass windows for the element with the atomic number 92.  Actually uranium glass was a “thing” once upon a time,, at least until the Cold War kicked in, putting a crimp in the supplies of uranium for glass plates and beads and that sort of thing.  

    Periodic table369


  • Money, Medical Treatment, and the Size of the Working Classes

    JF Ptak Science Books  Quick Post

    Medical costs359

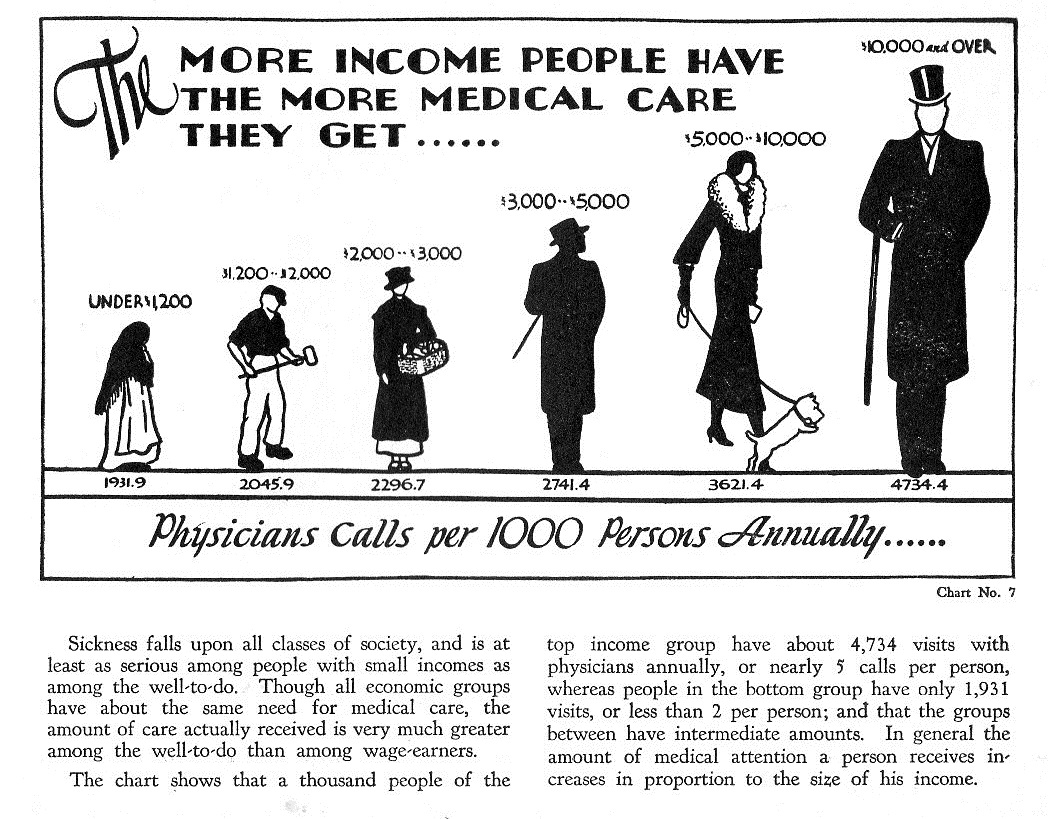
    A Picture-Book about the Costs of Medical Care was composed by the Julius Rosenwald Fund in 1932. One of the major data visualizations in the short pamphlet was the distribution of medical care according to income–and it comes as no surprise that during the Depression that the wealthiest people are enjoying more medical care than the other classes.  The stats are mostly not displayed in this pamphlet so there’s not much that I think I can say about them–except that it seems that the class distinctions/percentage in this  chart are similar to the William Thompson & Joseph Hickey (2005) class model.

    So from the Rosenwald Fund the numbers are described like so (with the addition of the bureau of Labor Statistic’s calculated figures for teh purchasing power of the 1932 dollar in 2016):

    • <$1,299, 15% of the population, ($20,957 in 2016 dollars)
    • $1,200-$2,000, 35% of the pop, ($34,938 in 2016 dollars)
    • $2,000-$3,000, 25% of the population ($52,392 in 2016 dollars)
    • $3,000-$5,000,  15% of the population, ($87,321 in 2016 dollars)
    • $5,000-$10,000, 7% of the population,  ($174,643 in 2016 dollars)
    • $10,000+, $2.9% population, (greater than $174,643 in 2016 dollars)

    The Thompson/Hickey model 

    • Upper 1% 
    • Upper middle class 15%
    • Lower Middle Class 32%
    • Working class 32%
    • Lower classes (including the working poor 20%

    The bottom two classes in the Rosenwald could constitute the poor and the working poor, making 50% which is what is most in-line with the Thompson/Hickey model. It is a little more difficult to work the numbers and try to distinguish the super rich, rich, upper middle class, and middle class in other models against the Rosenwald graphic. However when you look at two other models the poor and the working poor add up to about the same as above; the Dennis Gilbert model  (2002) finds 55% in this category and the Leonard Beeghley (2005) finds 57%. This is real smashmouth statistical surfing, I know, but it does seem as though there is a good correlation between the Rosenwald working class/working poor/poor numbers from 1932 and more recent models. 


  • Odd Maps: Earth as a Workplace for Trucks (1939)

    JF Ptak Science Books   Quick Post

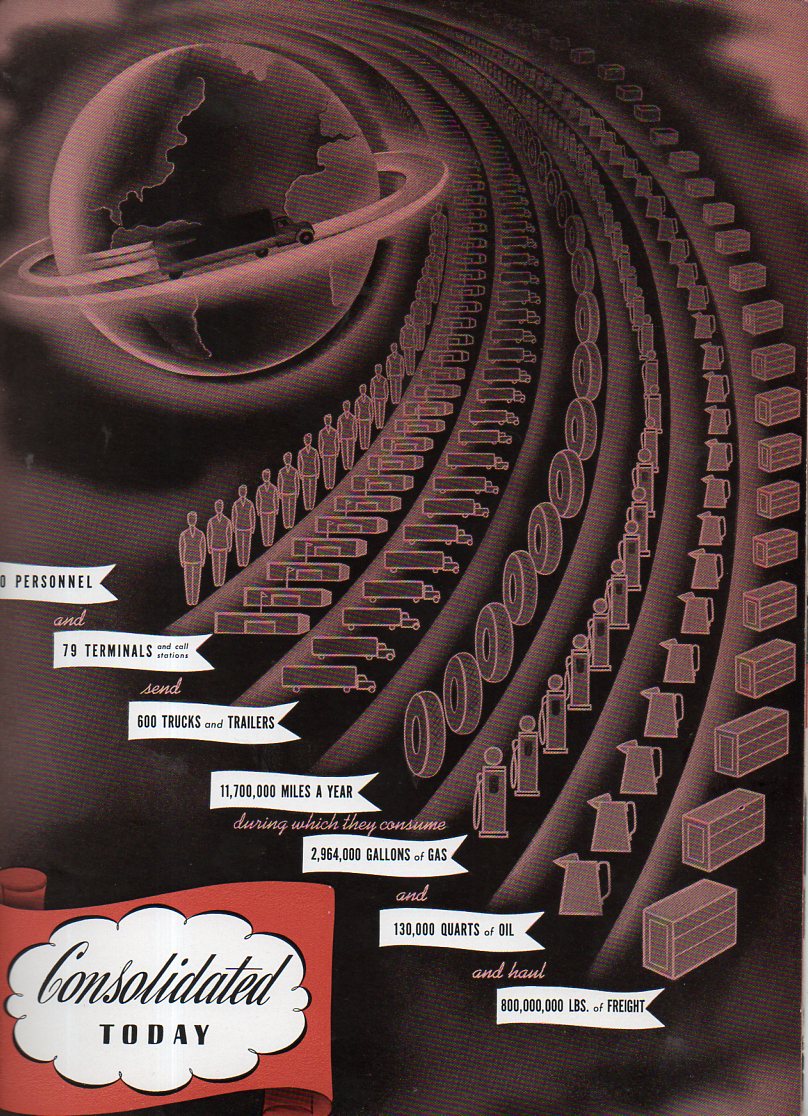
    You wouldn’t know about the highly-designed images in the work Highway Transportation by its title (“published in the interests of the shipping public”) by Consolidated Motor Lines Inc (1939). Nor would you assume how dry the interior was by the pamphlet’s cover. In any event the Earth  (with the poorly-drawn North America and the trunk-running ring around it)seems to be well under control by trucks, standing by in deference to the enormous quantities of oil consumed by trucks and other truck-related truck things, sweeping past it like the tail of a comet.  It is just an odd map, and that’s pretty much that. The sharp and streamlined plastic cover must’ve been shiny enough for everyone to think of it as an advanced work.   

    Map world truck346


    And the equally odd and slightly disturbing streamline-y cover:


  • The “Endless Immensity” of Thomas Wright, 1750

    JF Ptak Science Books  

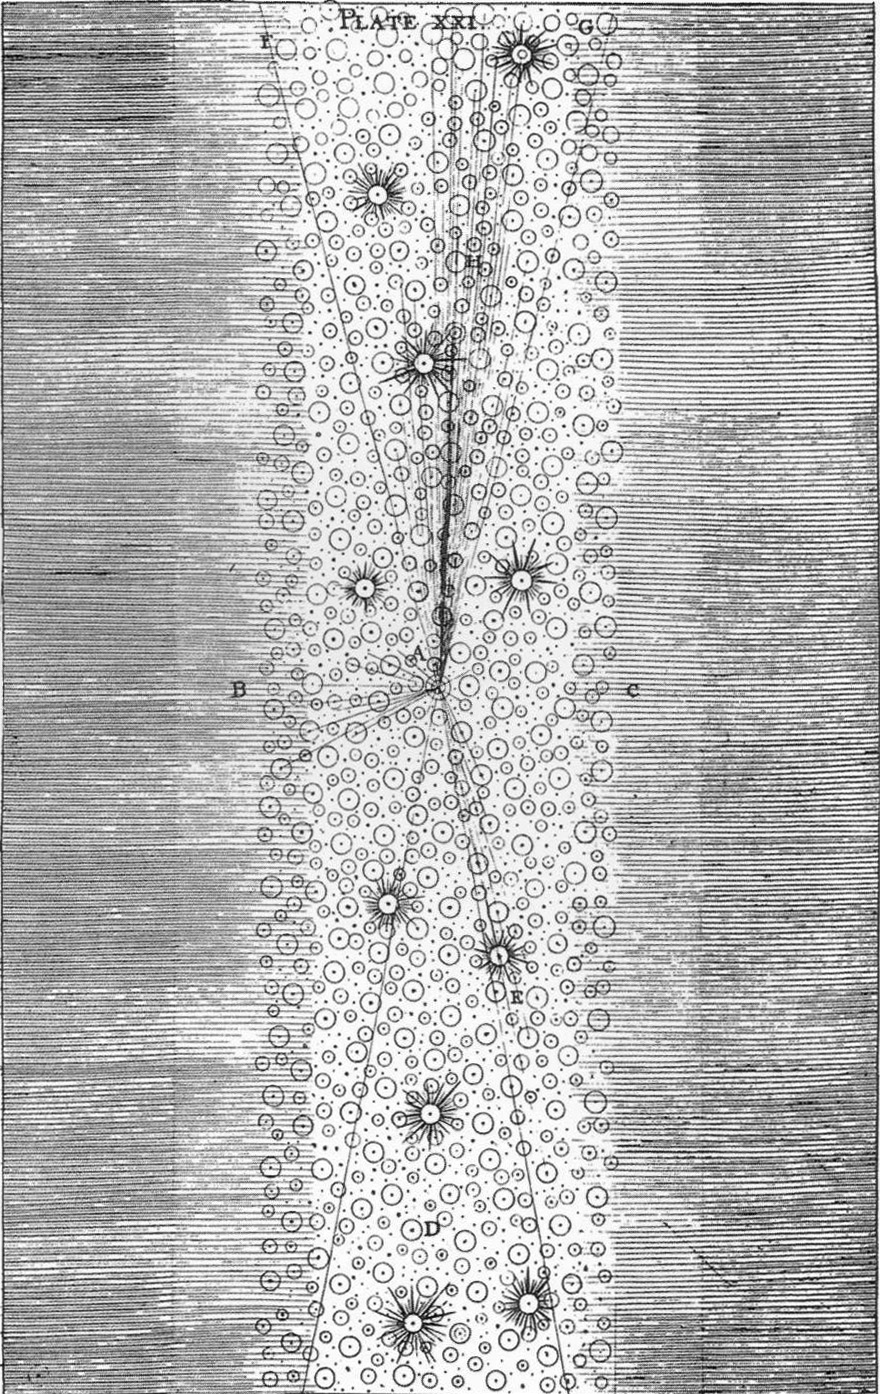
    Thomas Wright (1711-1786) saw about as deeply into the deep as just about anyone else–he looked into the night sky and pretty much saw all of it. In his book, An Original Theory or New Hypothesis of the Universe, Founded upon the Laws of Nature1, he described a version of the universe that was influential in the thinking of Kant and Herschel, finding a rectangular/squashed “finite infinity” of stars, “a vast infinite Gulph, or Medium, every Way extended like a Plane, and inclosed between two Surfaces”.

     Wright thomas [plate 23

    Our Milky Way, which at the time was thought to be the entire universe rather than a galaxy as it was later discovered to be–one galaxy in a seemingly endless sea of galaxies–was presciently seen by Wilkins as being but one assembly of stars in an “endless immensity” of stars:

    “And farther since without any impiety; since
    as the creation is, so is the Creator also magni-
    fied, we may conclude in consequence of an in-
    finity, and an infinite all-active power; that is
    the visible creation is supposed to be full of si-
    derial systems and planetay worlds, so on, in
    like similar manner, the endless immensity is an
    unlimited plenum of creations not unlike the
    known Universe.”–page 143. (Again, the “Universe” referred to here is the Milky Way galaxy.)

    Wright’s vision of this plethora of universes, in which each creation is one like the Milky Way–a radical thought in 1750:

    Wright 32


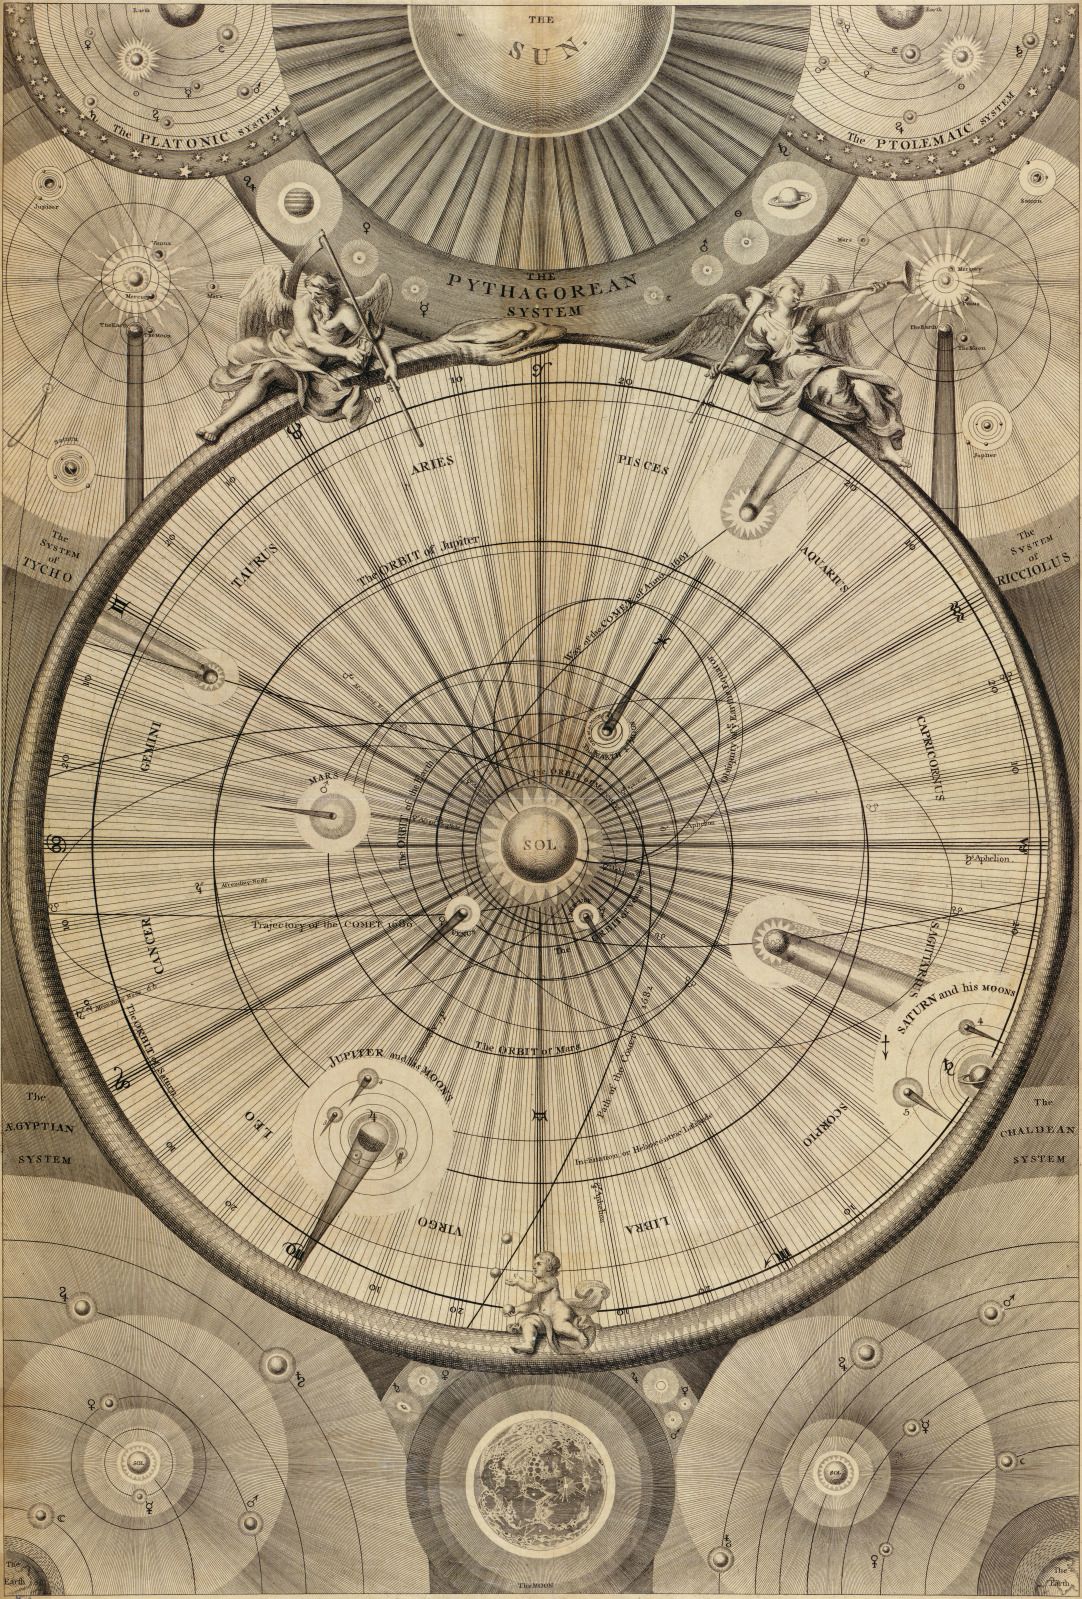
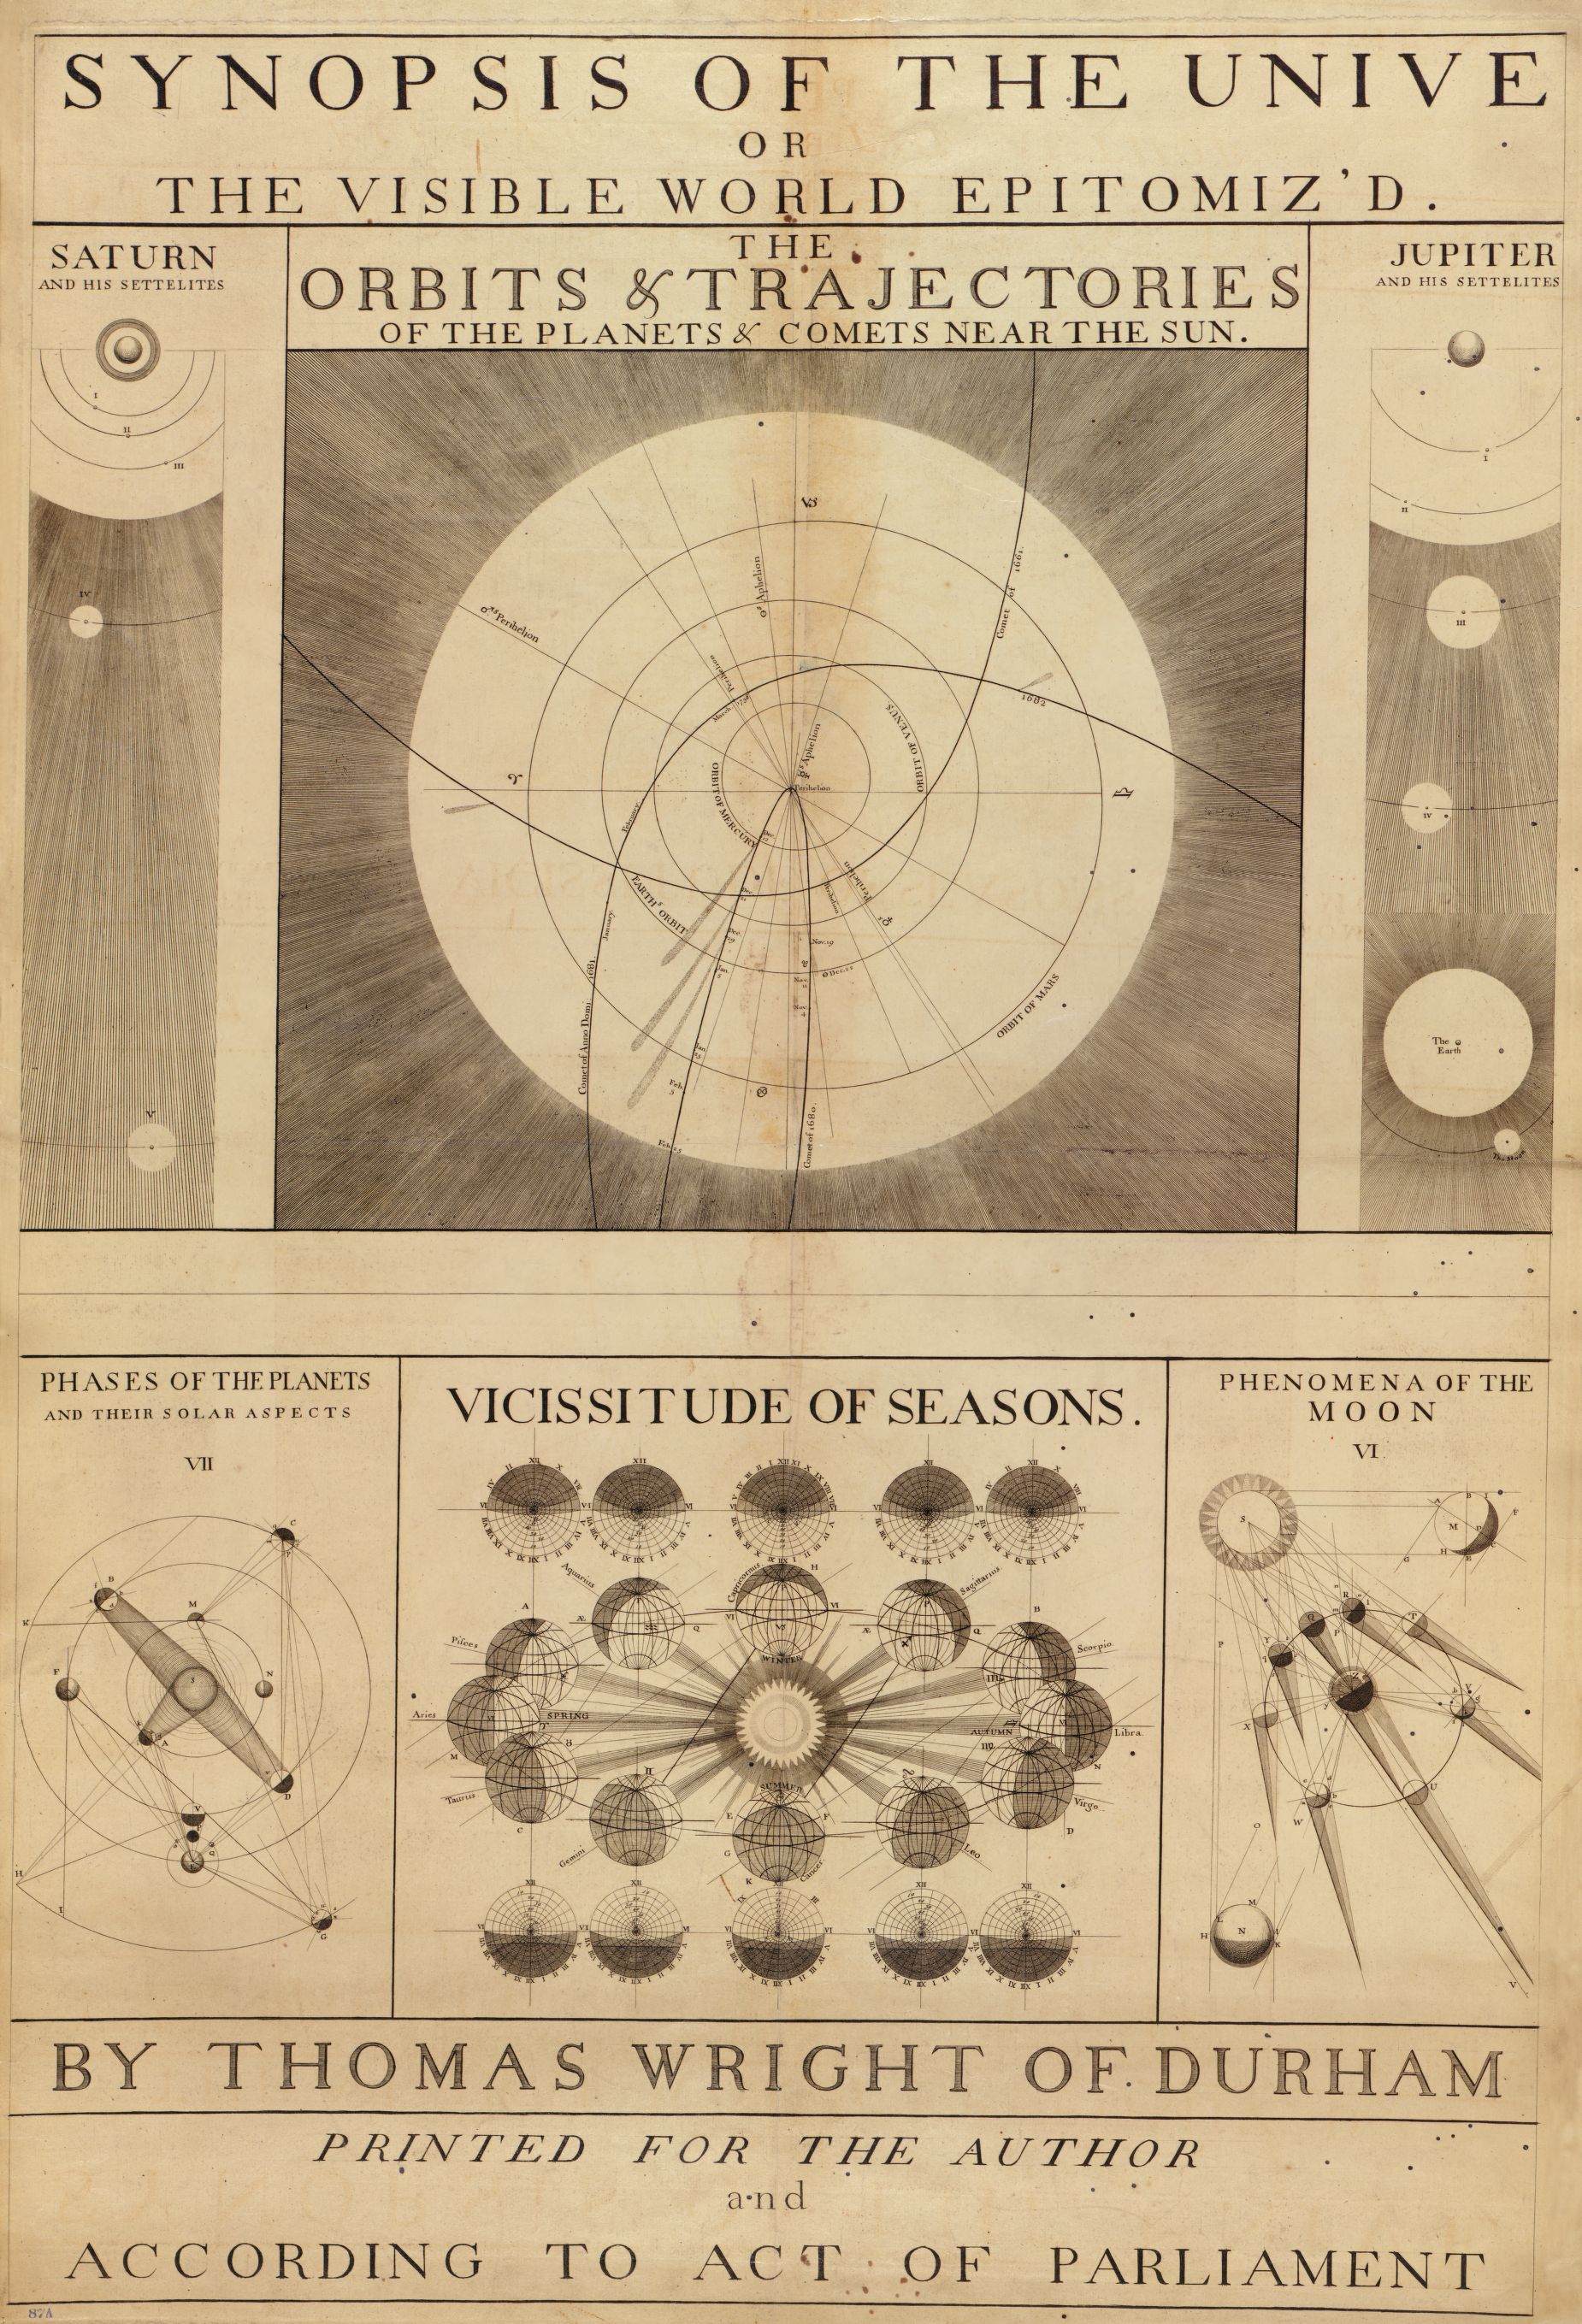
    And another view of this idea, from Wright’s  A synopsis of the universe, or, the visible world epitomiz’d (1742, being 13 maps on 3 sheets):

    Map celestial


    [Source: the Library of Congress.  https://www.loc.gov/item/2008621668/   Part of me wants to include the first Wright engraving in this blog’s series on the History of Lines, seeing as how they represent the great Something that seem to be infinitely binding the infinity of universes…]

    And another from these sheets:

    Maps Wright synopsis of the universe

    [Source: the Library of Congress.  https://www.loc.gov/item/2008621668/]

    Wright on the “plurality of systems” ( from his An Original Theory or New Hypothesis of the Universe … 1750)

    Wright also writes on the minuteness of the human condition, of the perfect sense of nothingness that is the Earth in a sea of infinite possibilities of other earths and earthy creations, which was definitely an outpost of thinking in 1750:

    “In this great celestial creation, the catastro-
    phe of a world, such as ours, or even the to-
    tal dissolution of a system of Worlds, may pos-
    sibly be no more to the great author of nature,
    than the most common accident in life with us,
    and in all probability such final and general
    doom-days may be as frequent there, as even
    birth-days, or mortality with us upon the Earth.
    This idea has something so cheerful in it, that
    I own I can never look upon the Stars without
    wondering why the whole world does not be-
    come Astronomers; and that men endowed with
    sense and reason, should neglect a science they
    are naturally so much interested in, and so ca-
    pable of enlarging the understanding, as next to
    a demonstration, must convince them of their
    immortality, and reconcile them to all those lit-
    tle difficulties incident to human nature, with-
    out the least anxiety.”–page 132

    Notes

    1.  The full title:  An Original Theory or New Hypothesis of the Universe, Founded upon the Laws of Nature, and solving by Mathematical Principles the General Phenomena of the Visible Creation ; and particularly the Via Lactea. Comprised in Nine Familiar Letters from the Author to his Friend. And illustrated with upwards of thirty graven and mezzo-tinted Plates by the best Masters. London, MDCCL.” Full test, here.

     2. An odd note about Thomas Wright’s personal history, from Science, 1902: “A word, in passing, about Wright. Like many another, so unfortunate as to live ere the times were ripe, he has been consigned to unmerited oblivion. Even the writer of the entry upon him in the ‘ Dictionary of National Biography ‘—a work so uniformly accurate — is unaware of the sources from which information could have been obtained, and so has nothing to tell, — does not even know the dates of his birth and death, or why he was called ‘of Durham.”–[Science, N. S. Vol. XIII. No. 321. 2-22-1902

    An interesting poem by Rafinesque to start of his edition of Wilkins:

    “Where ends the range and limits have been set
    To mortal eyes, there mental sight begins
    To fathom space, and worlds invisible
    Surveys, admires
    The mind must feel that space can have no bound*,
    Whatever number be of things or thoughts
    Others may be beyond—and thus behind
    The Nebulas and Belts, our Galaxies
    Of stormy clouds and oceans
    There stands the central land and throne
    Of our wide Universe, the home of Angels,
    The seat of Love Divine”
    Rafinesque, Poem on Instability, found at the beginning of Rafinesque’s 1837 American edition of Wright’s 1750 work. 


  • Germany/Czechoslovakia, 1932

    JF Ptak Science Books   Quick Post

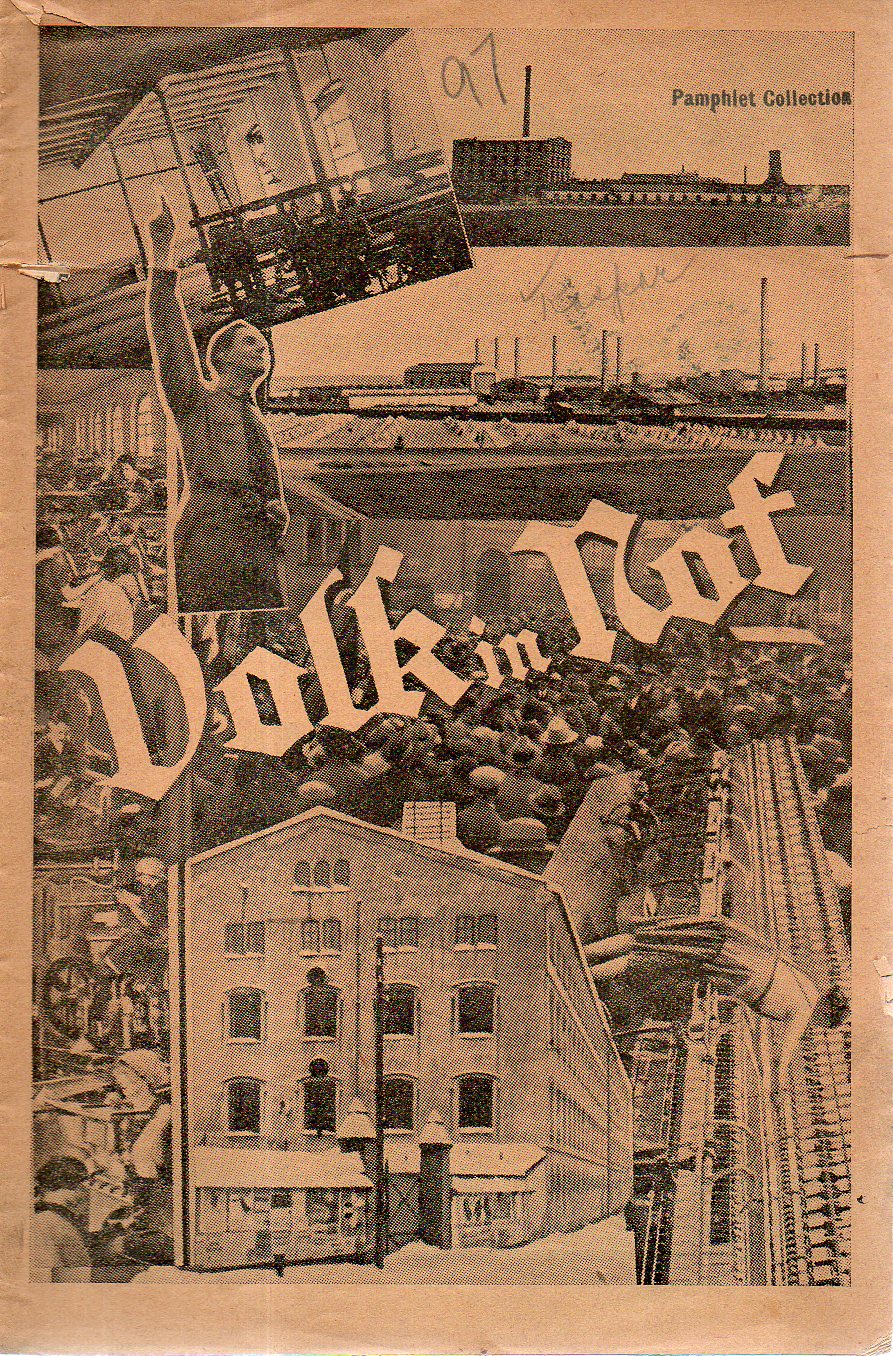
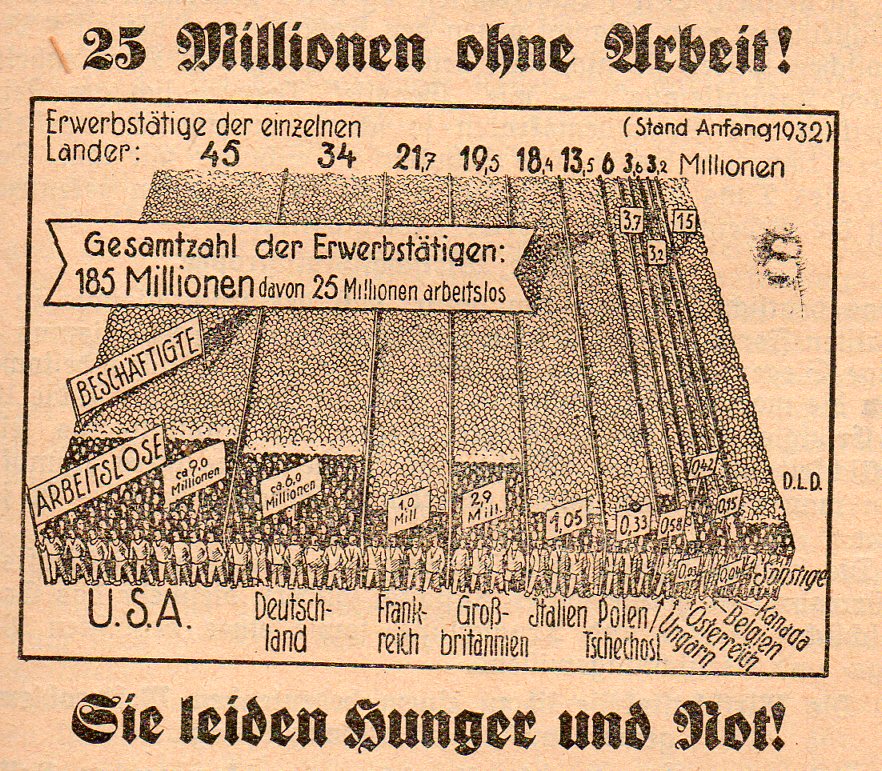
    The quick post this morning centers on design and the presentation of information–and it comes from a very uncommon and unsavory source. The pamphlet is by Rudolf Kasper, Sudetendeutsche Wirtschaftsnot! : Der Niedergang der sudetendeutschen.Wirtschaft seine Ursachen und der neue Weg zu Arbeit, Freiheit und Brot which on the cover of the publication becomes  Volk in Not. It was published in 1932 by DNSAP (German National Socialist Workers’ Party), which was an anti-Communist, anti-Capitalist, anti-Semitic, and other anti- things, and written by the German Nationalist Kasper, who after the Czech sell-out and invasion of 1938 became a Nazi and ultimately a Waffen SS.  Well, penultimately he became a prisoner of the Soviets and then ultimately dead at their hands, somehow, in 1947, under unknown conditions. (As Mr. Vonnegut would say, “so it goes”.)  The pamphlet is an appeal to the Sudeten Germans, offering an explanation for their failure at teh hands of the Czechs as well as a broad determination of how to fix things for the future, fixing the unemployment situation (there and so far as I can tell worldwide) for people to have a chance at “Work, Freedom, and Bread” (“zu Arbeit, Freiheit und Brot”).  Ah, yes.  Once the Nazis took control in Czechoslovakia, the DNSAP disappeared, outlawed–of course Kasper didn’t and simply moved on to his new Nazisness.  
    I’m posting about this because the pamphlet just doesn’t appear anywhere–there is only one copy of it located in libraries worldwide (Bayerische Staatsbibliothek) according to WorldCat/OCLC–and I just wanted to surface the thing.  

    The montage cover (8″x 5″):

    Weimar pamphlet Volk in Rot325

    And the display of the unemployed  (2″x 2.5″):

    Weimar pamphlet Volk in Rot326(“You are Suffering Famine and Distress!”) 

    So, there you have it. There’s a lot of unpleasant stuff in this pamphlet that would be fervent feed for the developing downfall of Czechoslovakia six years hence, though we don’t need to get into that where–as I said, I just wanted to surface this pamphlet and bring some notice to its existence.