A Daily History of Holes, Dots, Lines, Science, History, Math, Physics, Art, the Unintentional Absurd, Architecture, Maps, Data Visualization, Blank and Missing Things, and so on. |1.6 million words, 7500 images, 4.9 million hits| Press & appearances in The Times, Le Figaro, Mensa, The Economist, The Guardian, Discovery News, Slate, Le Monde, Sci American Blogs, Le Pont, and many other places… 5000+ total posts since 2008.

Category: Information, Quantitative Display of

  • A Fine Map from Alexander von Humboldt (1851)

    JF Ptak Science Books   Post 2793

    Before the Neil deGrasse Tyson version and update of Carl Sagan’s landmark television series, Cosmos, there was Alexander von Humboldt, and his enormously influential book of the same title, printed in 1845-1862.  Well, von Humboldt’s (1769-1859) book was actually Kosmos when published in German, which is where it started its life (and which von Humboldt suffered mightily for in it English translation).  Von Humboldt was enormously studied and educated and of a high scientific mind over many subjects, one of those 19th century figures who seemed as though they could know everything, a polymath of high order (along the lines of Goethe and von Helmholtz and Thomas Young and others).  He was a meteorologist and biogeographer before those sciences existed; a naturalist, geographer, archaeologist, and explorer, a natural philosopher of magnitudes.
    Maps dataviz land wasser156

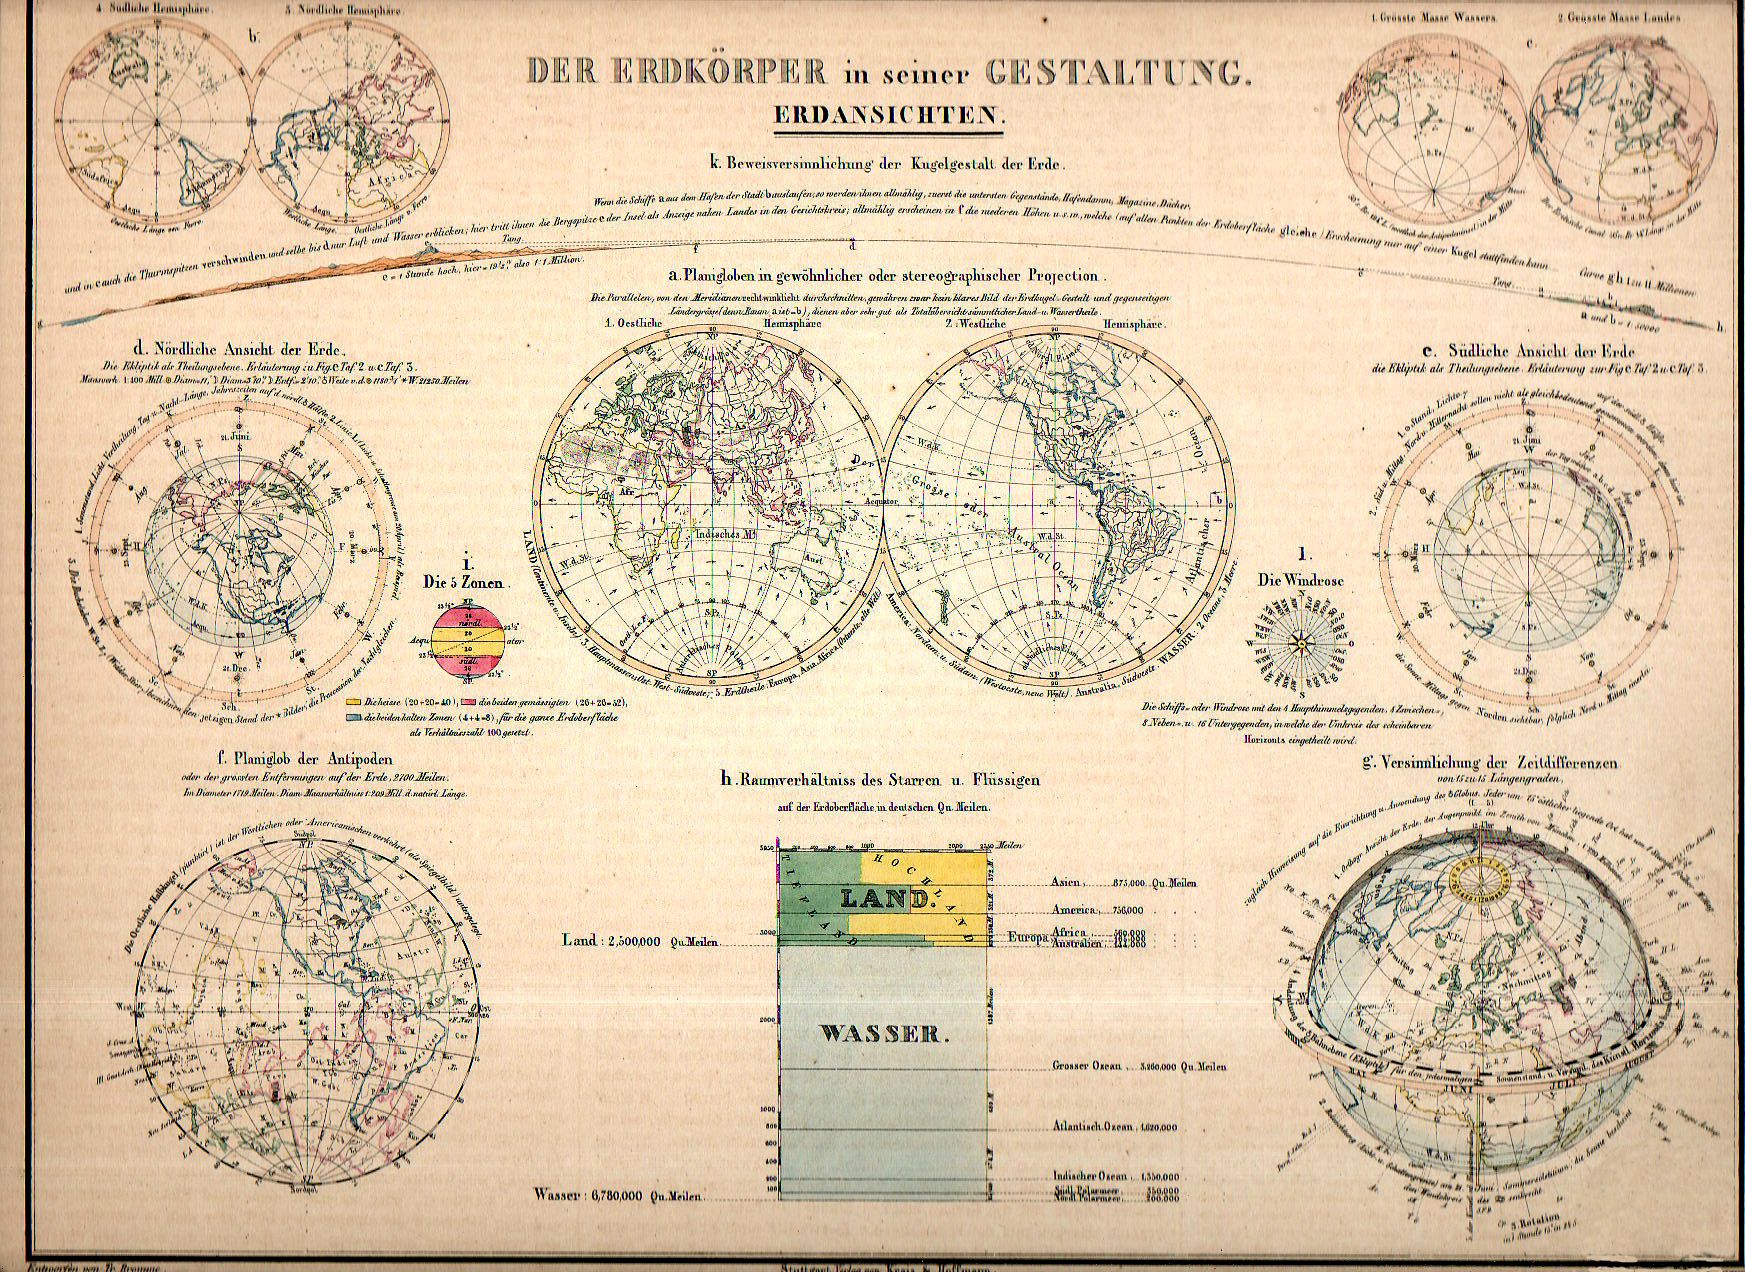
    • “Der Erdkorper in seiner Gestaltung. Erdansichten. Entworfen von Tr. Bromme. Ausgefuhrt v. E. Winckelmann”, published in Stuttgart, by Verlag von Krais & Hoffman.  This map appeared in  the atlas of Alexander von Humboldt’s Kosmos, 1851.  8.5×11.5″ image on 11×13″ sheet, with original hand coloring.

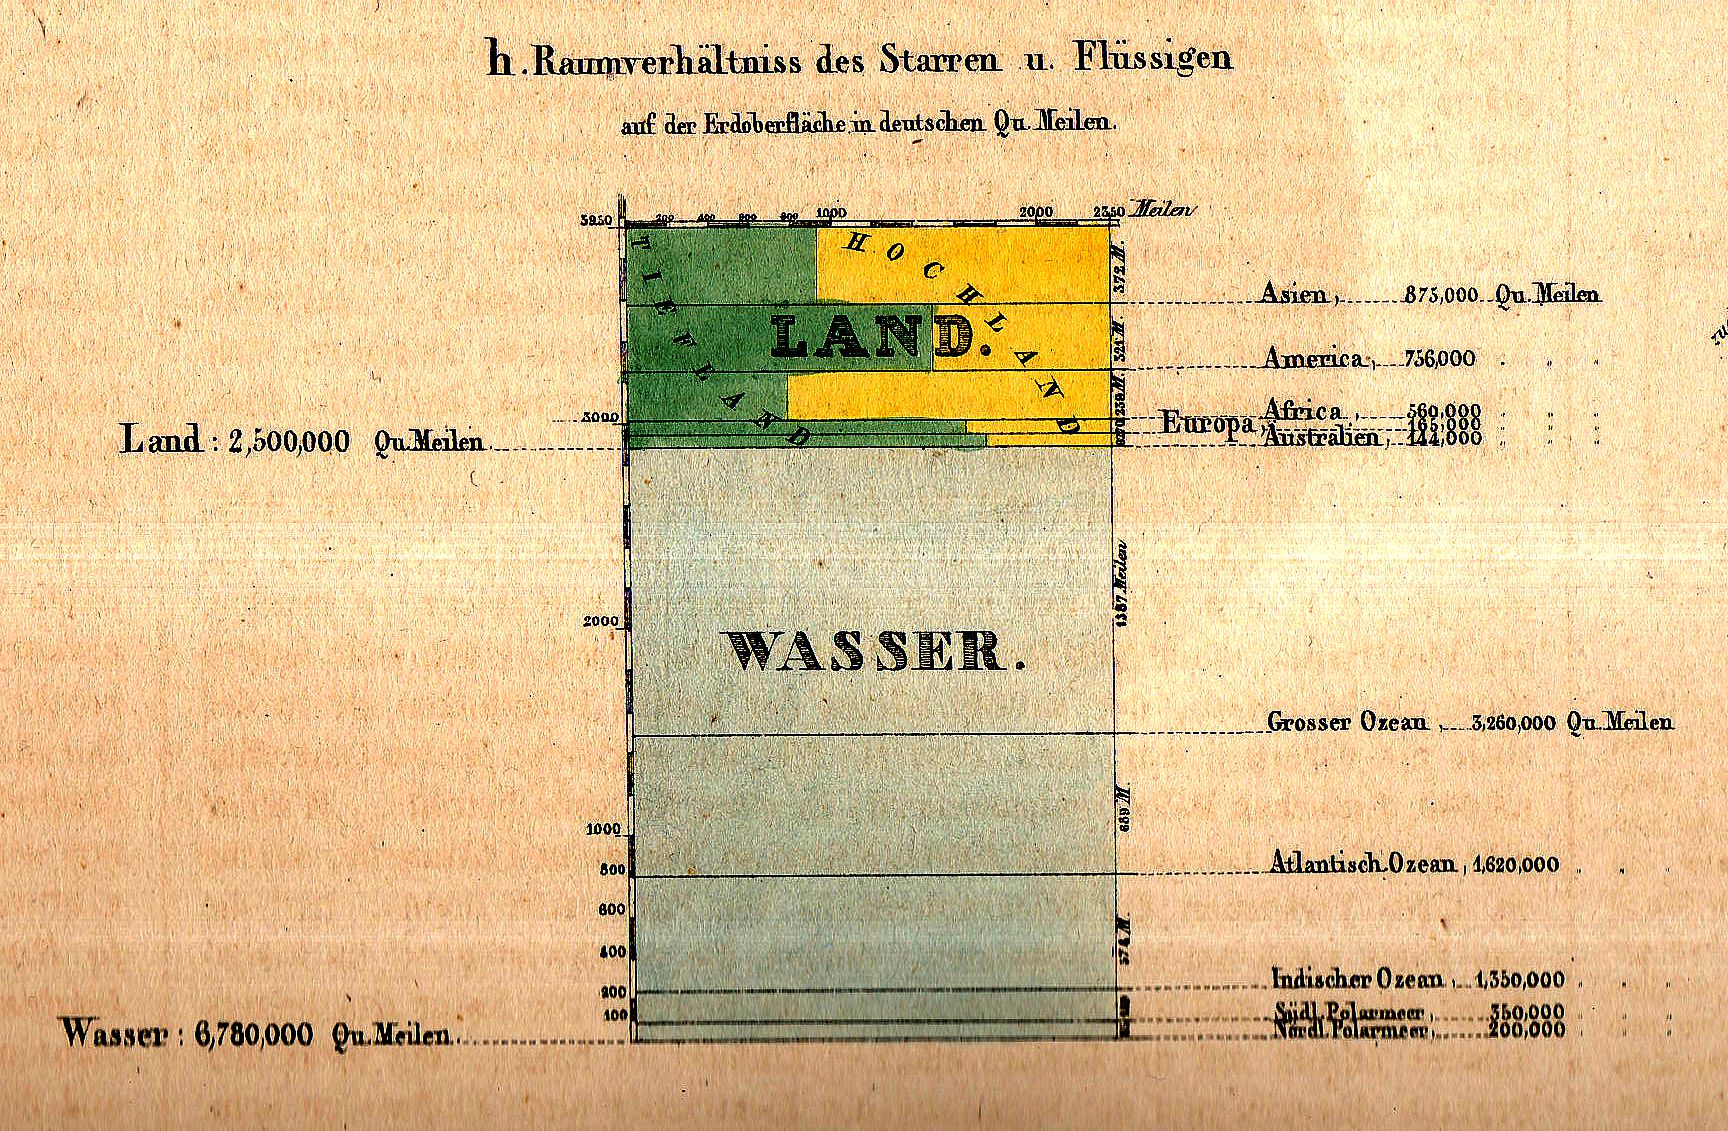
    And this fabulous small detail from the overall map:
    Maps dataviz land wasser detail

    Kosmos reflected his lifelong interest in order, and what he did was astonishing–he attempted to unifying the complexities of nature in one book (of five volumes), binding the various branches of science together in a cohesive whole, attempting to show how the laws of the universe acted here on Earth.  It was a very influential work, very progressive, a masterwork of scientific method.  

    Sagan (and Tyson, soon) tried to explain what the universe was all about; 160+ years ago, so did von Humboldt, and for his time he came damned close to doing so, or as close as anyone could possibly come. 

    The fine little inset above (1×1.5 inches in real life) is an excellent display of water/land mass of the Earth, and is but one of eleven such images on this beautiful image.

  • History of Lines Department: Supply and Demand (1870)

    JF Ptak Science Books   Quick Post

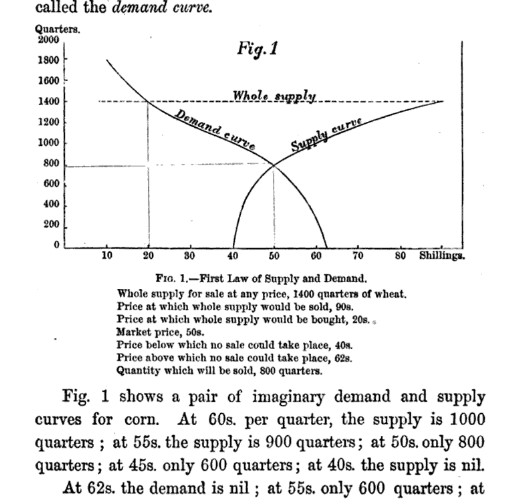
    The idea/phrase “supply and demand” goes back a very long way, and gets treated in a more-modern aspect by Locke (1767) and Adam Smith (1776) and David Ricardo (1813) and Thomas Malthus (1803)–however, the  first time that the idea was presented graphically came with (the beautifully-named) Fleeming Jenkin in 1870. The famous graph appeared in  “Graphic Representation of the Laws of Supply and Demand, their Application to Labour, Part I”, published in Recess Studies, edited by Sir Alexander Grant and published in Edinburgh.  And here it is, in brilliant simplicity:

    Supply and demand

    He writes in this paper by way of introduction:

    “Supply at a price denotes the quantity which at a given price holders would be then and there willing to sell. Supply at a price is also mensurable Demand at a price denotes the quantity which then and there buyers would purchase at that price. The supply at a price and the demand at a price in any given market will probably vary with the price they may be said to be functions of the price.”

    “Let a curve be drawn the abscissae of which represent prices and the ordinates the supplies at each price. This curve will be called the supply curve. A similar curve constructed with the demand at each price as ordinates will be called the demand curve.”

    A few notes in support of the Jenkin diagram:


  • The Beauty of the Nuts-and-Bolts of Bolts and Nuts (1864)

    JF Ptak Science Books  Quick Post 

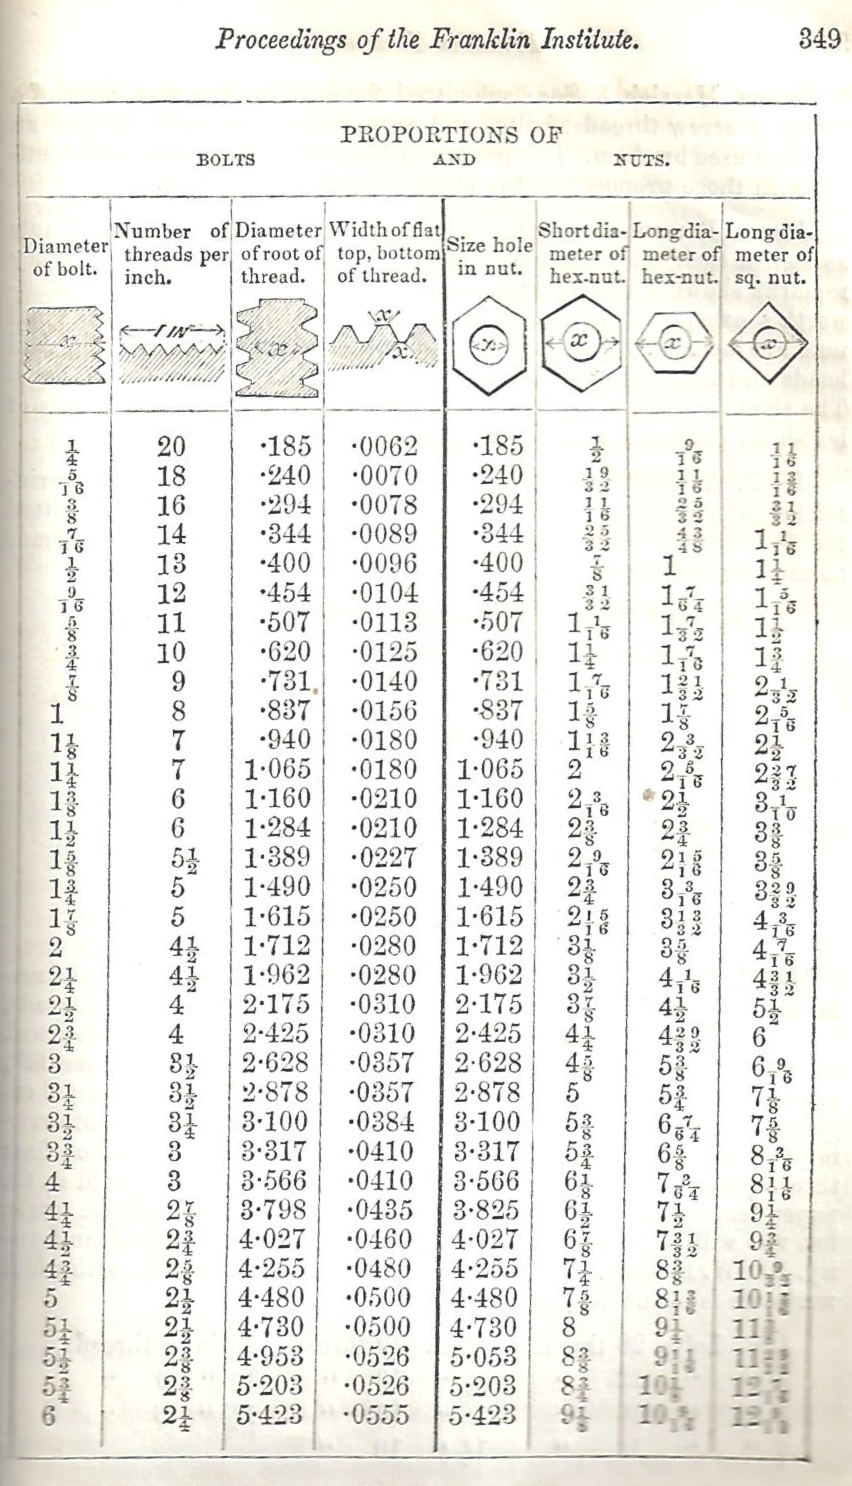
    JFI 1864 bolts (1)So, at first glance, this chart may look like a simple statement of nut and bolts specs. The importance of this chart is its commonplace appearance, and the overt statements about what all of these size and parameters should be, establishing a common denominator, a standard. Even though nuts and bolts had been around for at least 400 years when this chart appeared in the Journal of the Franklin Institute in 1864 (and threaded bolts and screws long before that), the idea of standardization of this hardware really hadn’t taken place until Joseph Whitworth gave the idea life in 1841. The nut and bolt industry was well underway, except that for X manufacturers there could be X-number of varieties of nut and bolt sizes from one location to another (near or far), which made things difficult for the end-user, as they could basically be using a proprietary design with their hardware. Standardization made it possible to buy a certain size nut in one country and mate it with the necessary bolt from another country (etc.) with the capacity of knowing that one will fit the other, which is a big deal. In any event, here’s a table of a U.S. attempt to codify those dimensions. 

            [See: W.R. Wilson,  The History of the Nut and Bolt Industry in America, 1905.]


  • Comparative Mapping of the Great Fires of the U.S. (1932)

    JF Ptak Science Books  Quick Post

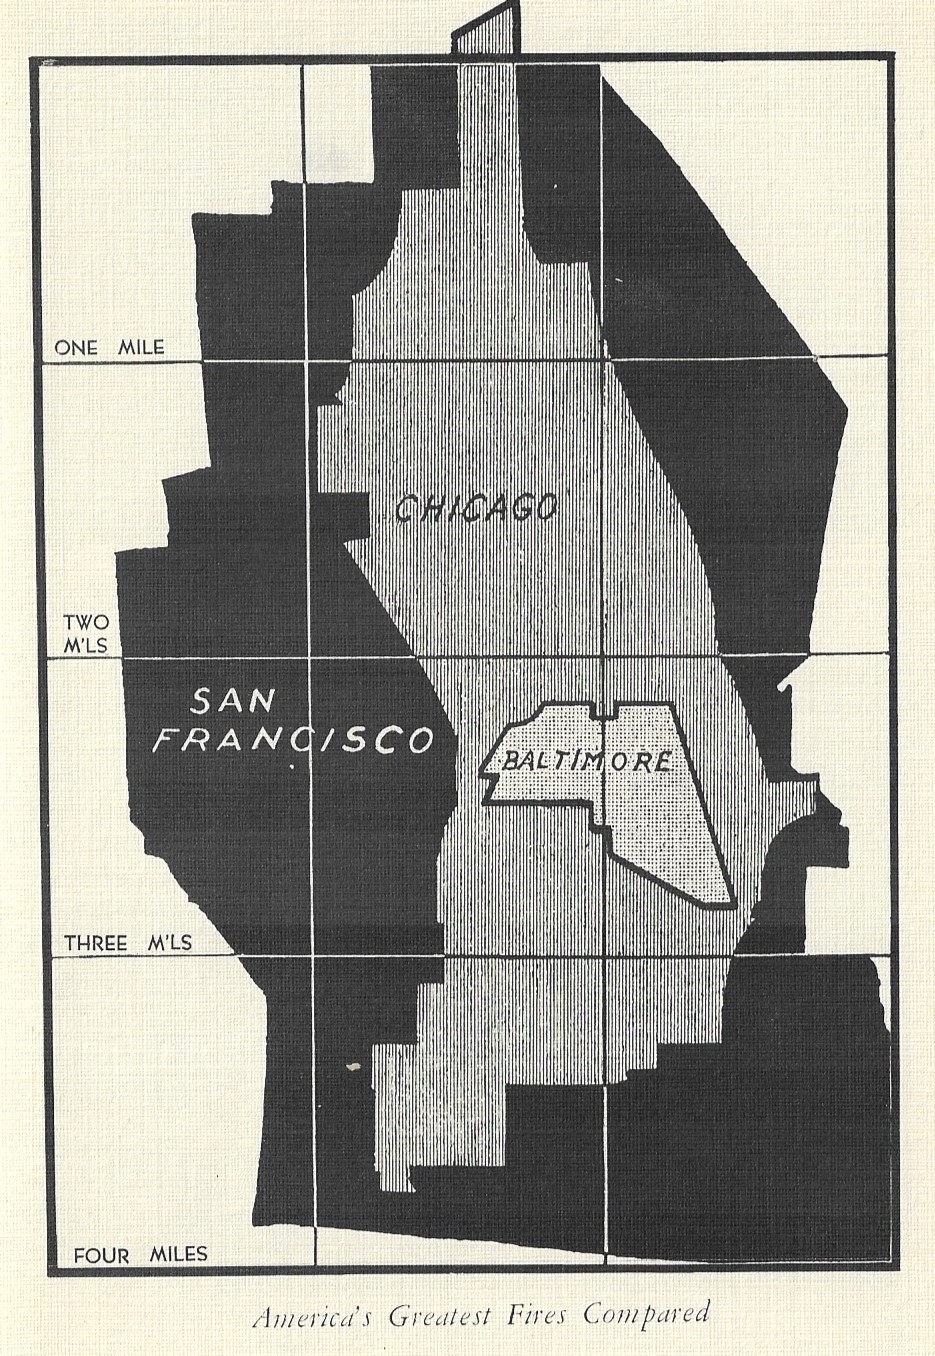
    Yes, this is a great cover, and it belongs to the designers for the National Fire Protection Association, who I guess were trying to, um, emphasize the terrible nature of The Big Fire in the course of its mission to sell fire insurance, which of course is a good and necessary thing. The pamphlet (printed in 1936) details some of the biggest fires in U.S. history, Salem, Ma.; Paris, Tx. (two); Nashua, N.H.; Coney Island, Brooklyn; Crisfield, Md.; New Straitsville, Oh.; and of course the big ones in Boston, Atlanta, Chicago, Baltimore, and San Francisco. Of particular interest in this pamphlet is the comparative sizes of the three greatest fires, reproduced below. 

    Books covers conflagrations _2_

    Books covers conflagration


  • Word Images on the Longevity of Coal (1859)

    JF Ptak Science Books Quick Post

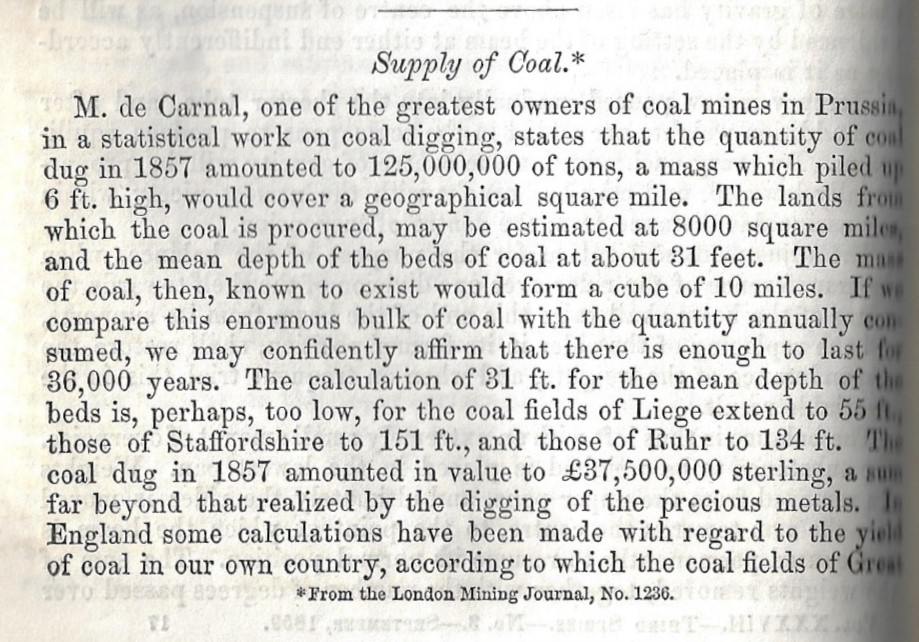
    In the last 24 hours I’ve come across two antiquarian outlooks on the longevity of the world coal supply after not having seen hardly anything of the sort written in the 19th century.  (The 20th century, even in its first decade or two, is another story.) The first was an article by the engineer John Ericsson, who wrote on the temperature of the heliosphere of the Sun in  Nature for 1871 (and came quite close) which led to an earlier paper from 1868 in which he hypothesized a short lifespan of coal and advocated for forms of “solar energy”. Then came this article from 1859 (in the month of publication of On the Origin of Species which hypothesized a much more abundant future for coal deposits, which the writer figured to be 36,000 years. Unfortunately his terms aren’t very well defined–was he addressing the coal production of Prussia or Europe or the world when discussing “the quantity of coal dug in 1857”? When stating “the lands from which the coal is procured” may be 8,000 square miles, did that mean an 8,000 square mile swath of Germany, or 8,000 square miles of mined coal in Europe, or etc.? New Hampshire is about 8,000 square miles, and the entire Prussian Monarchy was about 110,000 square miles, so maybe that meant packets of mining surfaces here and there? 

    I don’t know. But it was an interesting problem the writer set to work on, even though he didn’t really do the necessary work on the parameters or what the future might hold in reference to coal usage. The writer also painted several nice mental images in trying to visualize the great numbers involved with coal production and consumption.  Here’s the article in full: 


    JFI 1859 supply of coal


  • An Uncommon (?) Display of Scientific Discovery (1833)

    JF Ptak Science Books  Quick Post

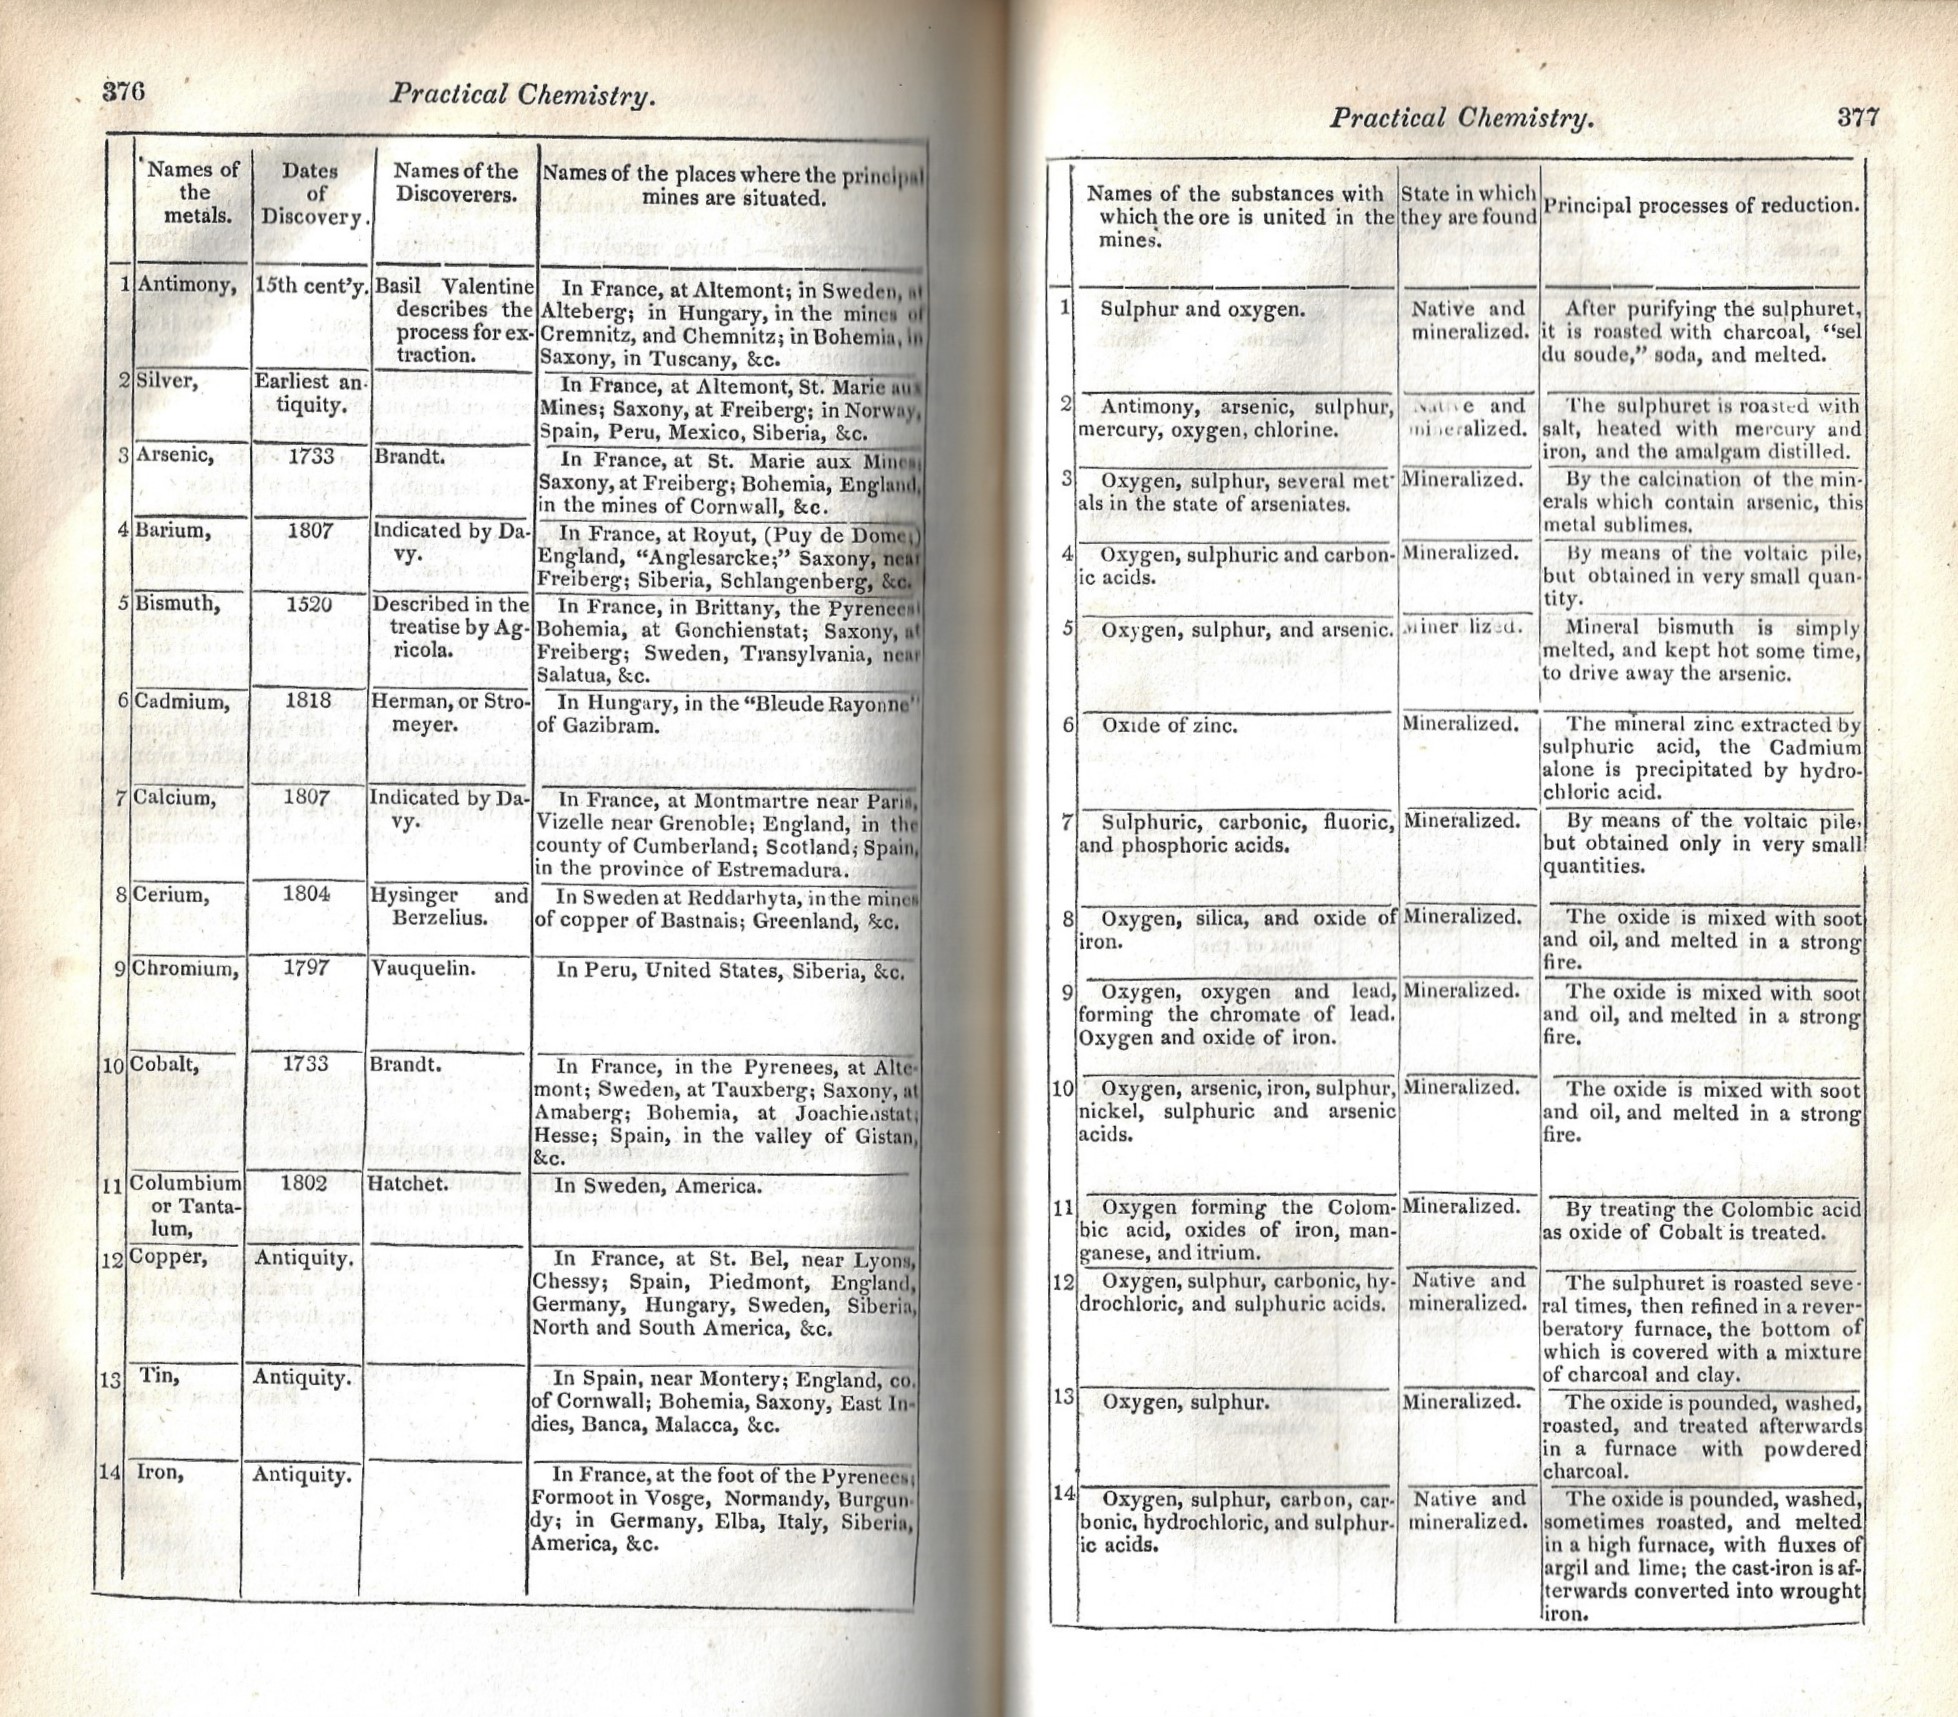
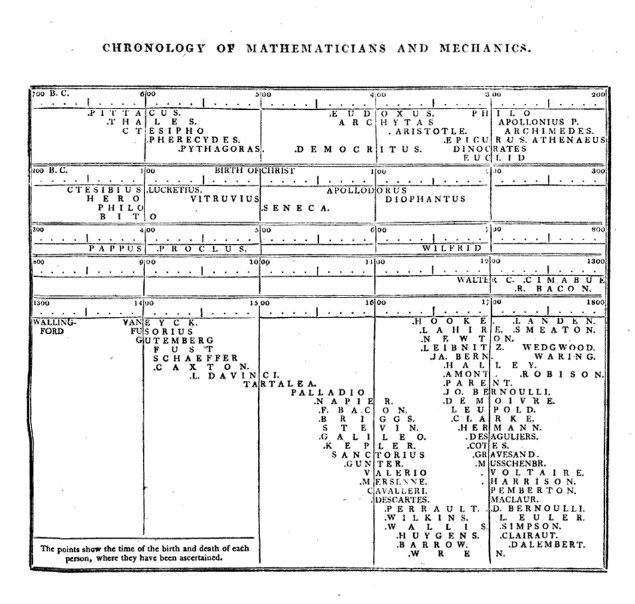
    When I saw this series of tables in a volume of the Journal of the Franklin Institute1 it struck me that I really didn’t recall very many instance at all of seeing chronological history of science (etc.) displays of info in antiquarian scientific texts. The practice was not terribly uncommon in atlases that would occasionally (as in Lavoisne’s Complete Genealogical, Historical, Chronological and Geographical Atlas of 1822) be illustrated with chronological historical tables. This one was a tabular presentation of 34 metals, listed alphabetically, and listing the year of discovery and discovery first—that was the unusual part. I recall that Thomas Young’s (1773-1829) A course of lectures on natural philosophy and the mechanical arts contained a series of timelines for the different disciplines (a sample of which is below)–including an unexpected entry for optics.

    In any event, I’ll save a longer post on this subject for later—for right now I’m going to share the entire article from the JFI:

    JFI 1833 Metals _1_

    The article is continued below; also find following a sample from the Thomas Young with a link to the full work:

    Thomas Young LEctures Timeline

    The link to the Young:

    https://archive.org/details/lecturescourseof02younrich/page/n6

    Notes:

    Franklin Peale, “Table of Properties &c., of the Metals, taken from a table by M. Chaudet of the Paris Mint”, pp 375-385. This is basically a tabular report on 34 metals, listed alphabetically, and including dates of discovery and the names of discoverers, plus the names and locations of the principle mines, plus color, character, stability, specific gravity, state in which the metals are found, and several other properties. Journal of the Franklin Institute, Philadelphia, 1836; volume 17 (new series) and volume 21 overall, with text illustrations and four plates, 440 pp


  • Admission Form to Institutions for the “Feebleminded” (1920)

    JF Ptak Science Books  Quick Post  (Part of the series on Blank, Empty, and Missing Things)

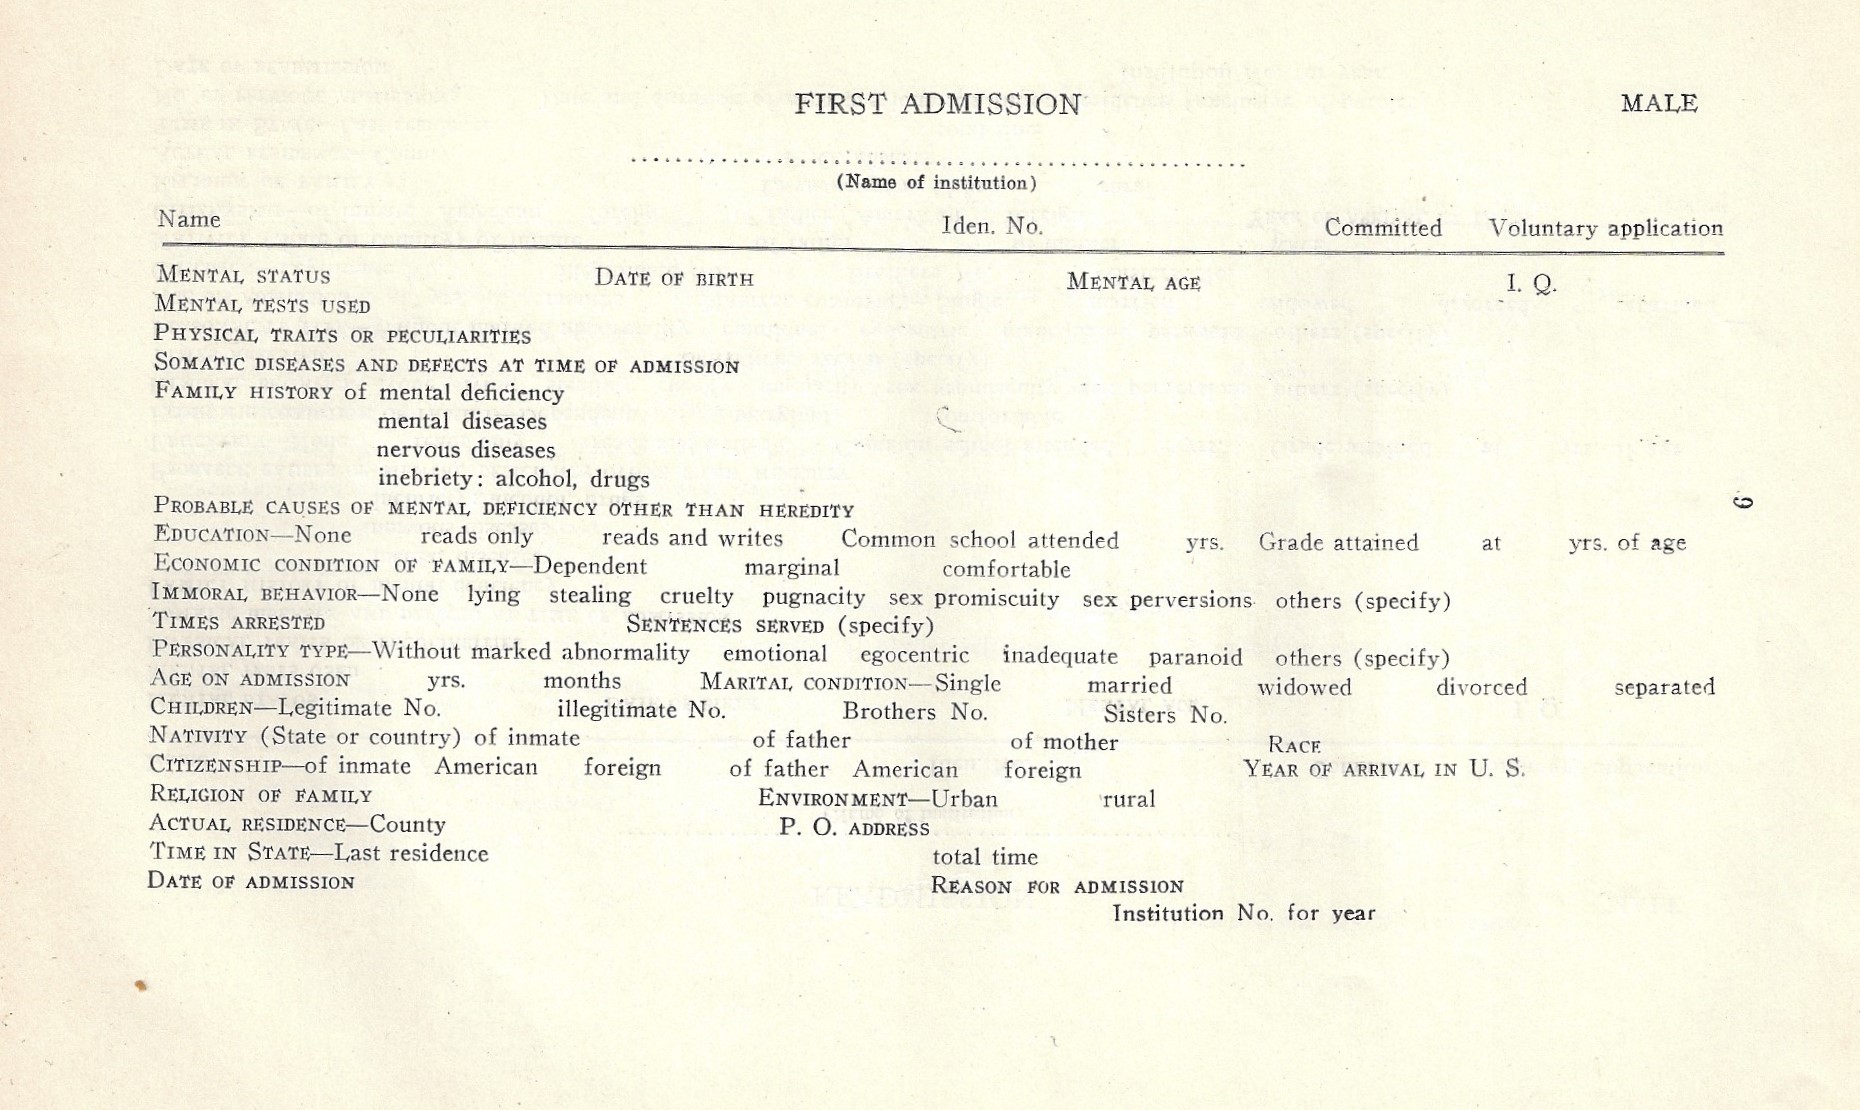
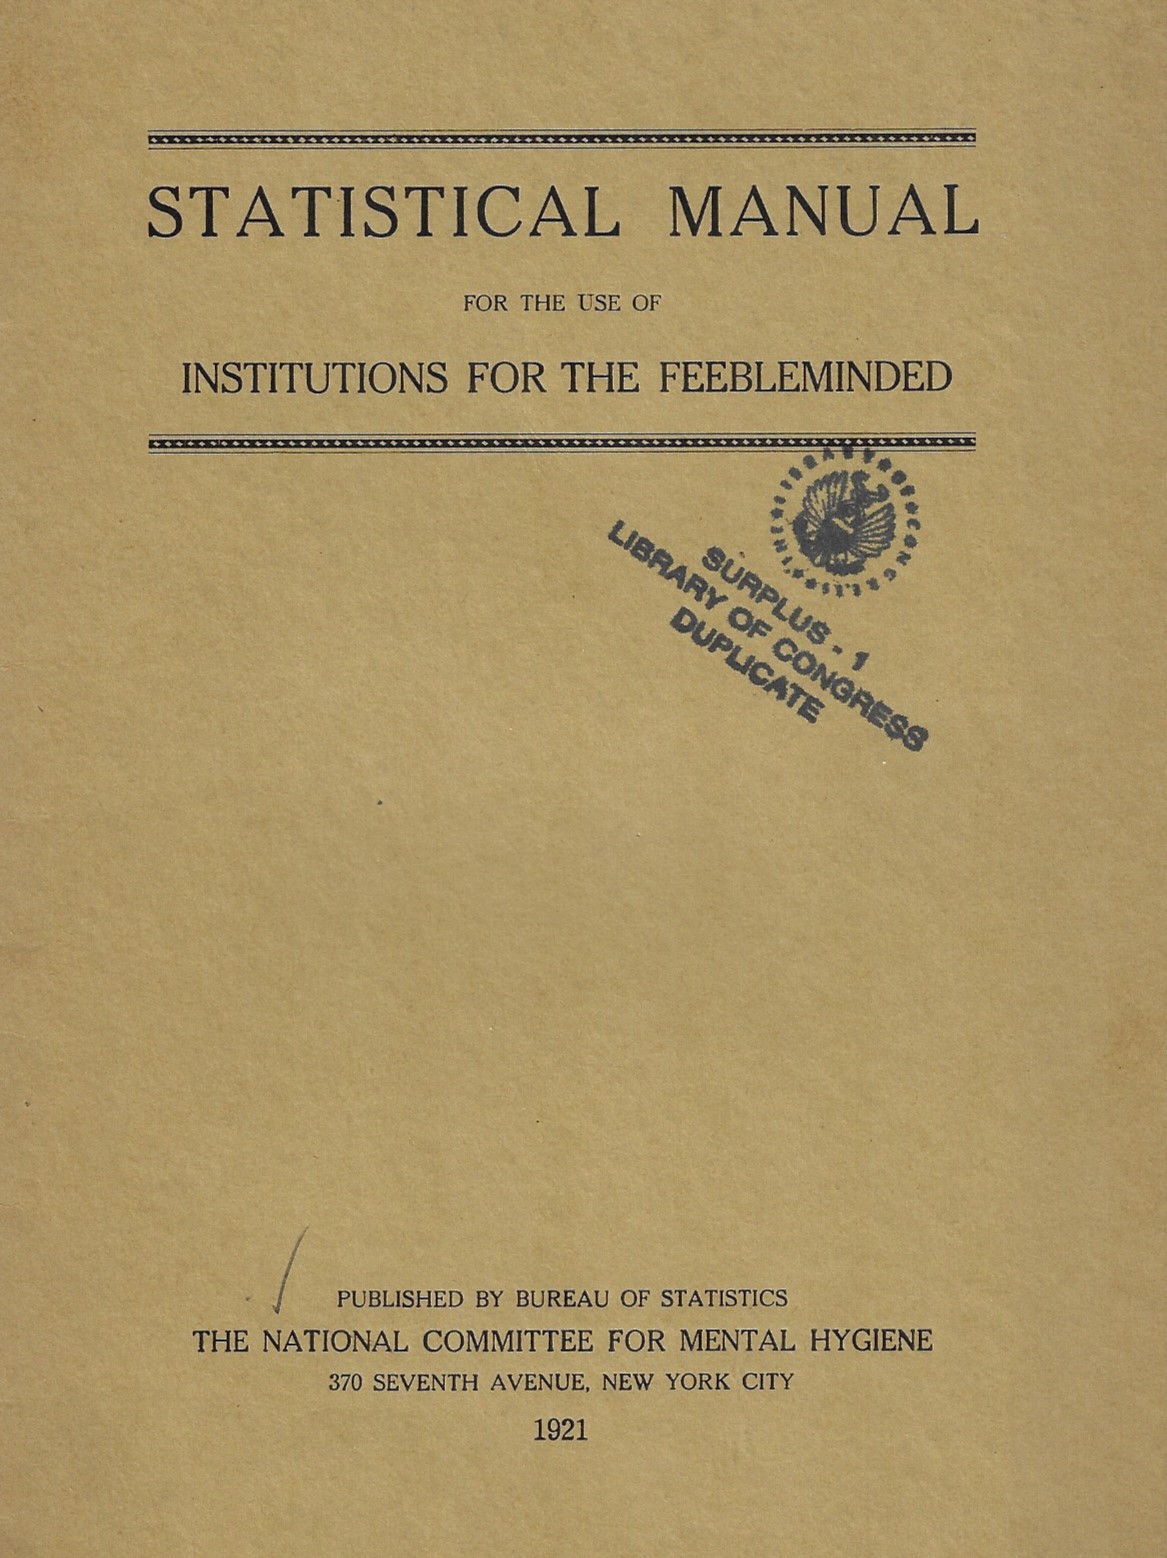
    The following form is one of six1 presented in a 1921 publication2 on institutions for the “feebleminded3“.  It was published by the National Committee for Mental Hygiene (370 Seventh Ave, NYC) and states that the forms represent a marked improvement in collecting and standardizing mental health data. Many of the terms are narrowly defined (or as narrowly as could be in a 40-page document), though when you consider the time in which it was accomplished this does seem to represent step forward in the creation of uniform statistics for people being treated for various sorts of mental diseases. 

    The “mental status” criteria to choose from includes “idiot, imbecile, or moron” while personality type classification included “emotional”, egocentric”, “inadequate”, “paranoid”, and “others to be specified”.  It is interesting to note that “egocentric” “includes those who are “egotistic, selfish, individualistic, superficial, and shallow in their moral feelings, inconsiderate of others, unappreciative, etc.” which could have included a lot of people, then as now. 

    Admission form mental hospital


    I should point out that the most discriminatory remarks for identifying the nationalities is in regards to Jewish people. For example, this guideline (based on the U.S. 1920 census guidelines) is offered to the admissions people:

    • “ENGLISH. Care must be given to exclude Hebrew who are born in England…”

    And this for “Hebrew”:

    • “HEBREW. No difficulty will be experienced in identifying Hebrews and they should be so classified without regard to the country from which they come.”

    Notes:

    1. The other forms are for readmission, parole, death, discharge, and transfer. 
    2.  The cover for this work:

    Admission form mental hospital

    3.  “Feebleminded” appears as a compound word in the OED, making an appearance as far back as 1534 in the Tyndale Bible, ” Comforte the feble mynded.”. The other uses of feeble-____ seem to all appear after that, including Feeble-bodied, -eyed, -framed, -hearted, and -winged. 


  • On the Speeds of Things (1883)

    JF Ptak Science Books  Quick Post

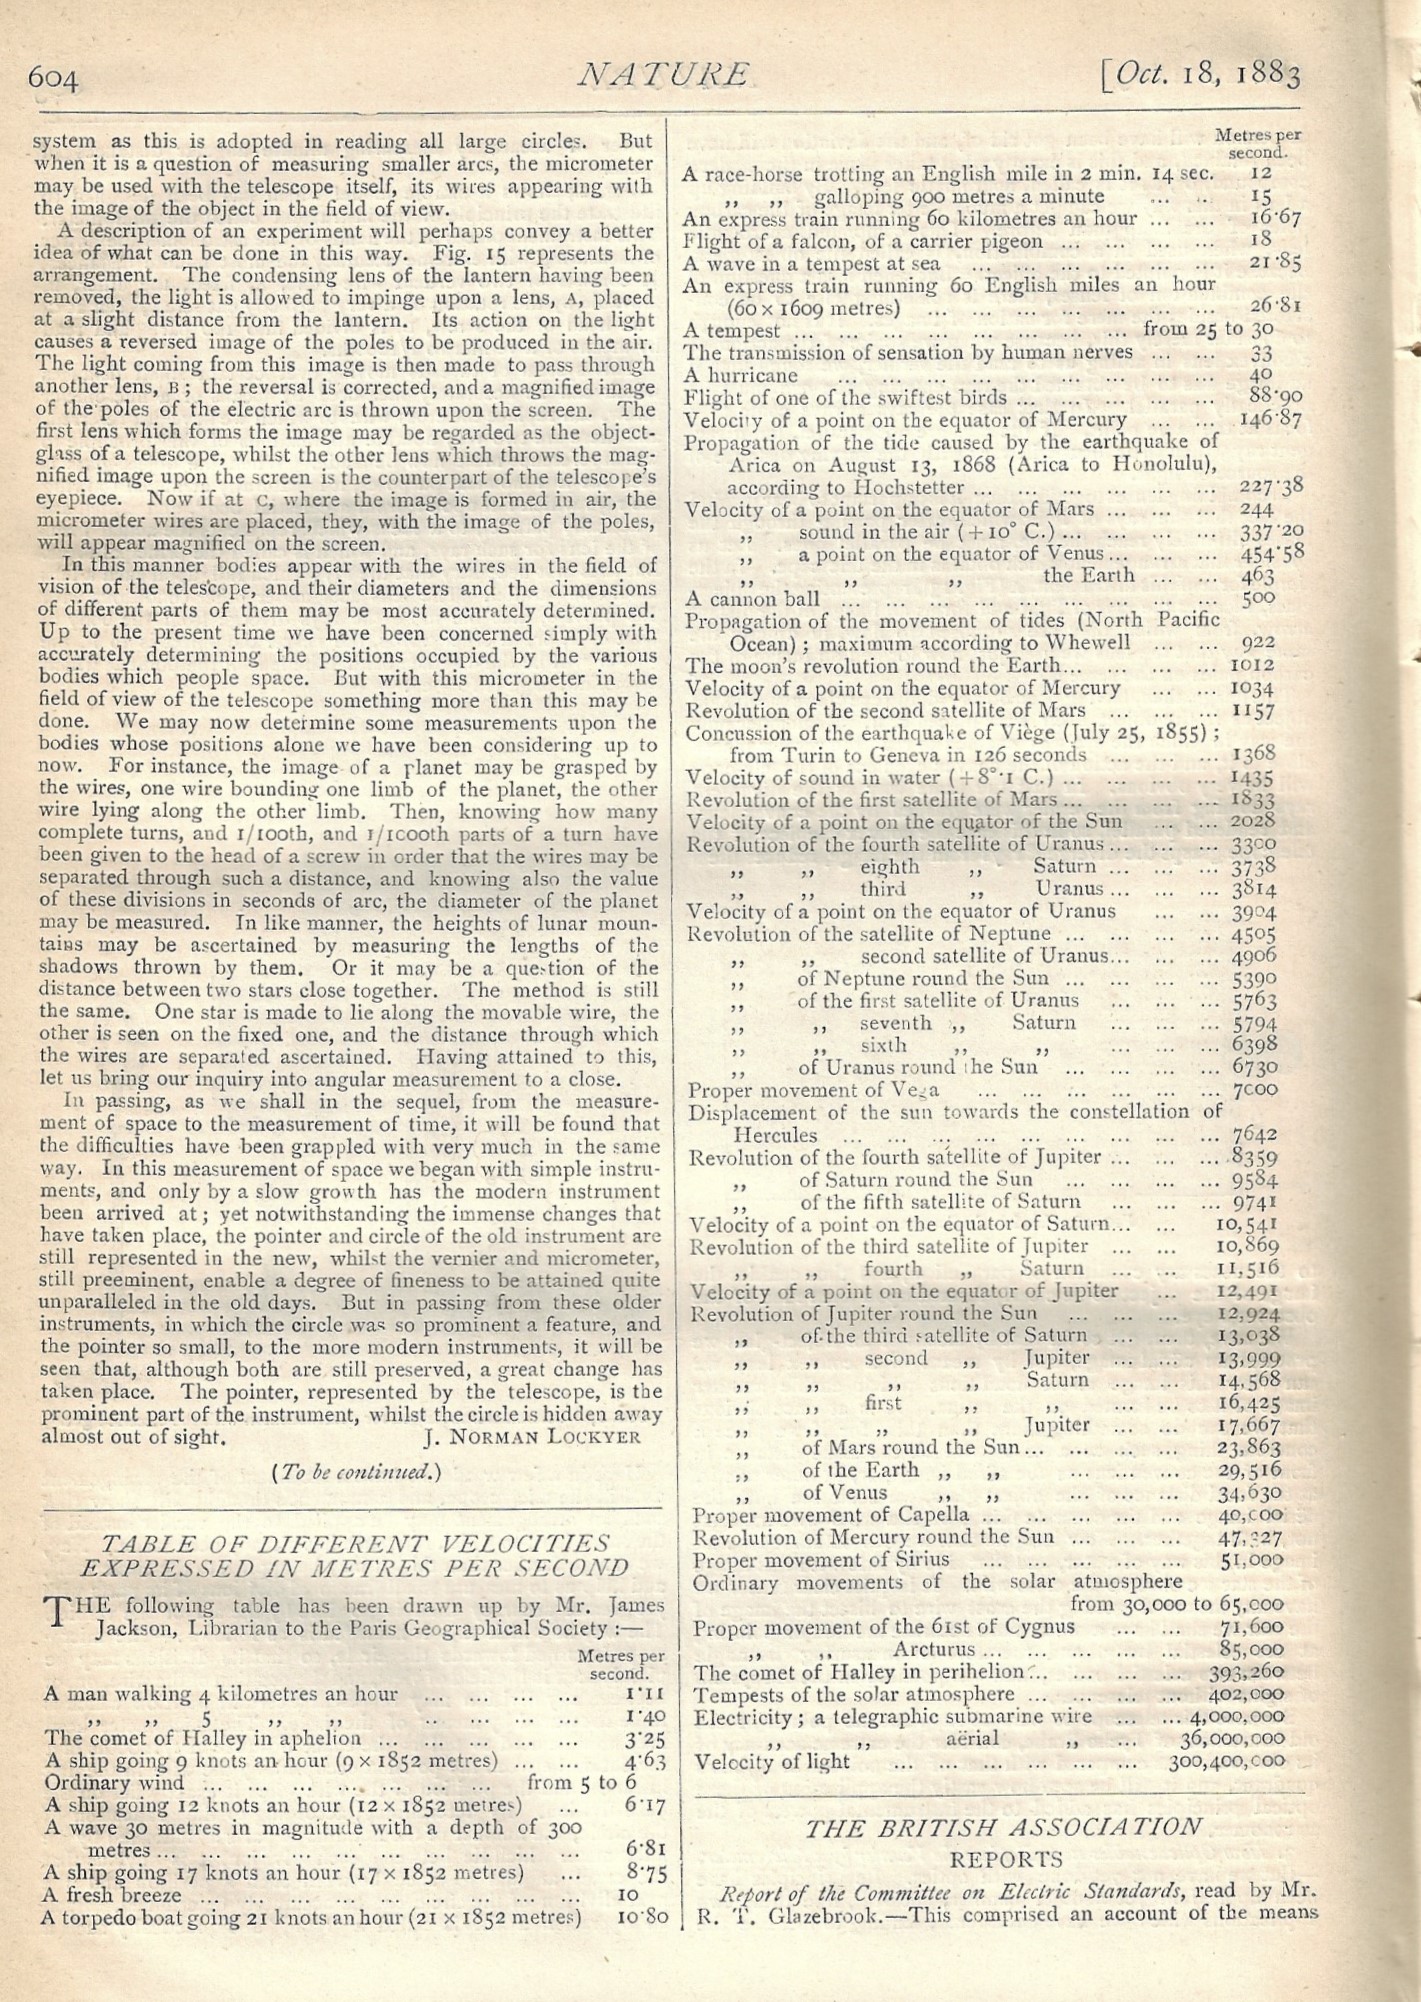
    Here’s an interesting collection of bits that I just came across in the October 18, 1883 issue of Nature, showing the speed of things.  Some of the examples are quite charming, showing the velocities for an “ordinary wind”, a “fresh breeze”, “a race horse trotting an English mile”, “flight of a falcon”, “flight of one of the swiftest birds”,  and “a tempest”; others show the speeds of things that are quite antique, like the velocity of “a cannon ball”, and “an express train travelling at 60 kph”. Then of course we get into the high velocity astronomical examples, all brought to a close by the speed of light. I like the list, and so I share it here:

    Nature 1883 veocity of stuff


  • Ships & Skyscrapers: Ships in the Skyline and a 2000′-Tall Building (1908)

    JF Ptak Science Books  Quick Post

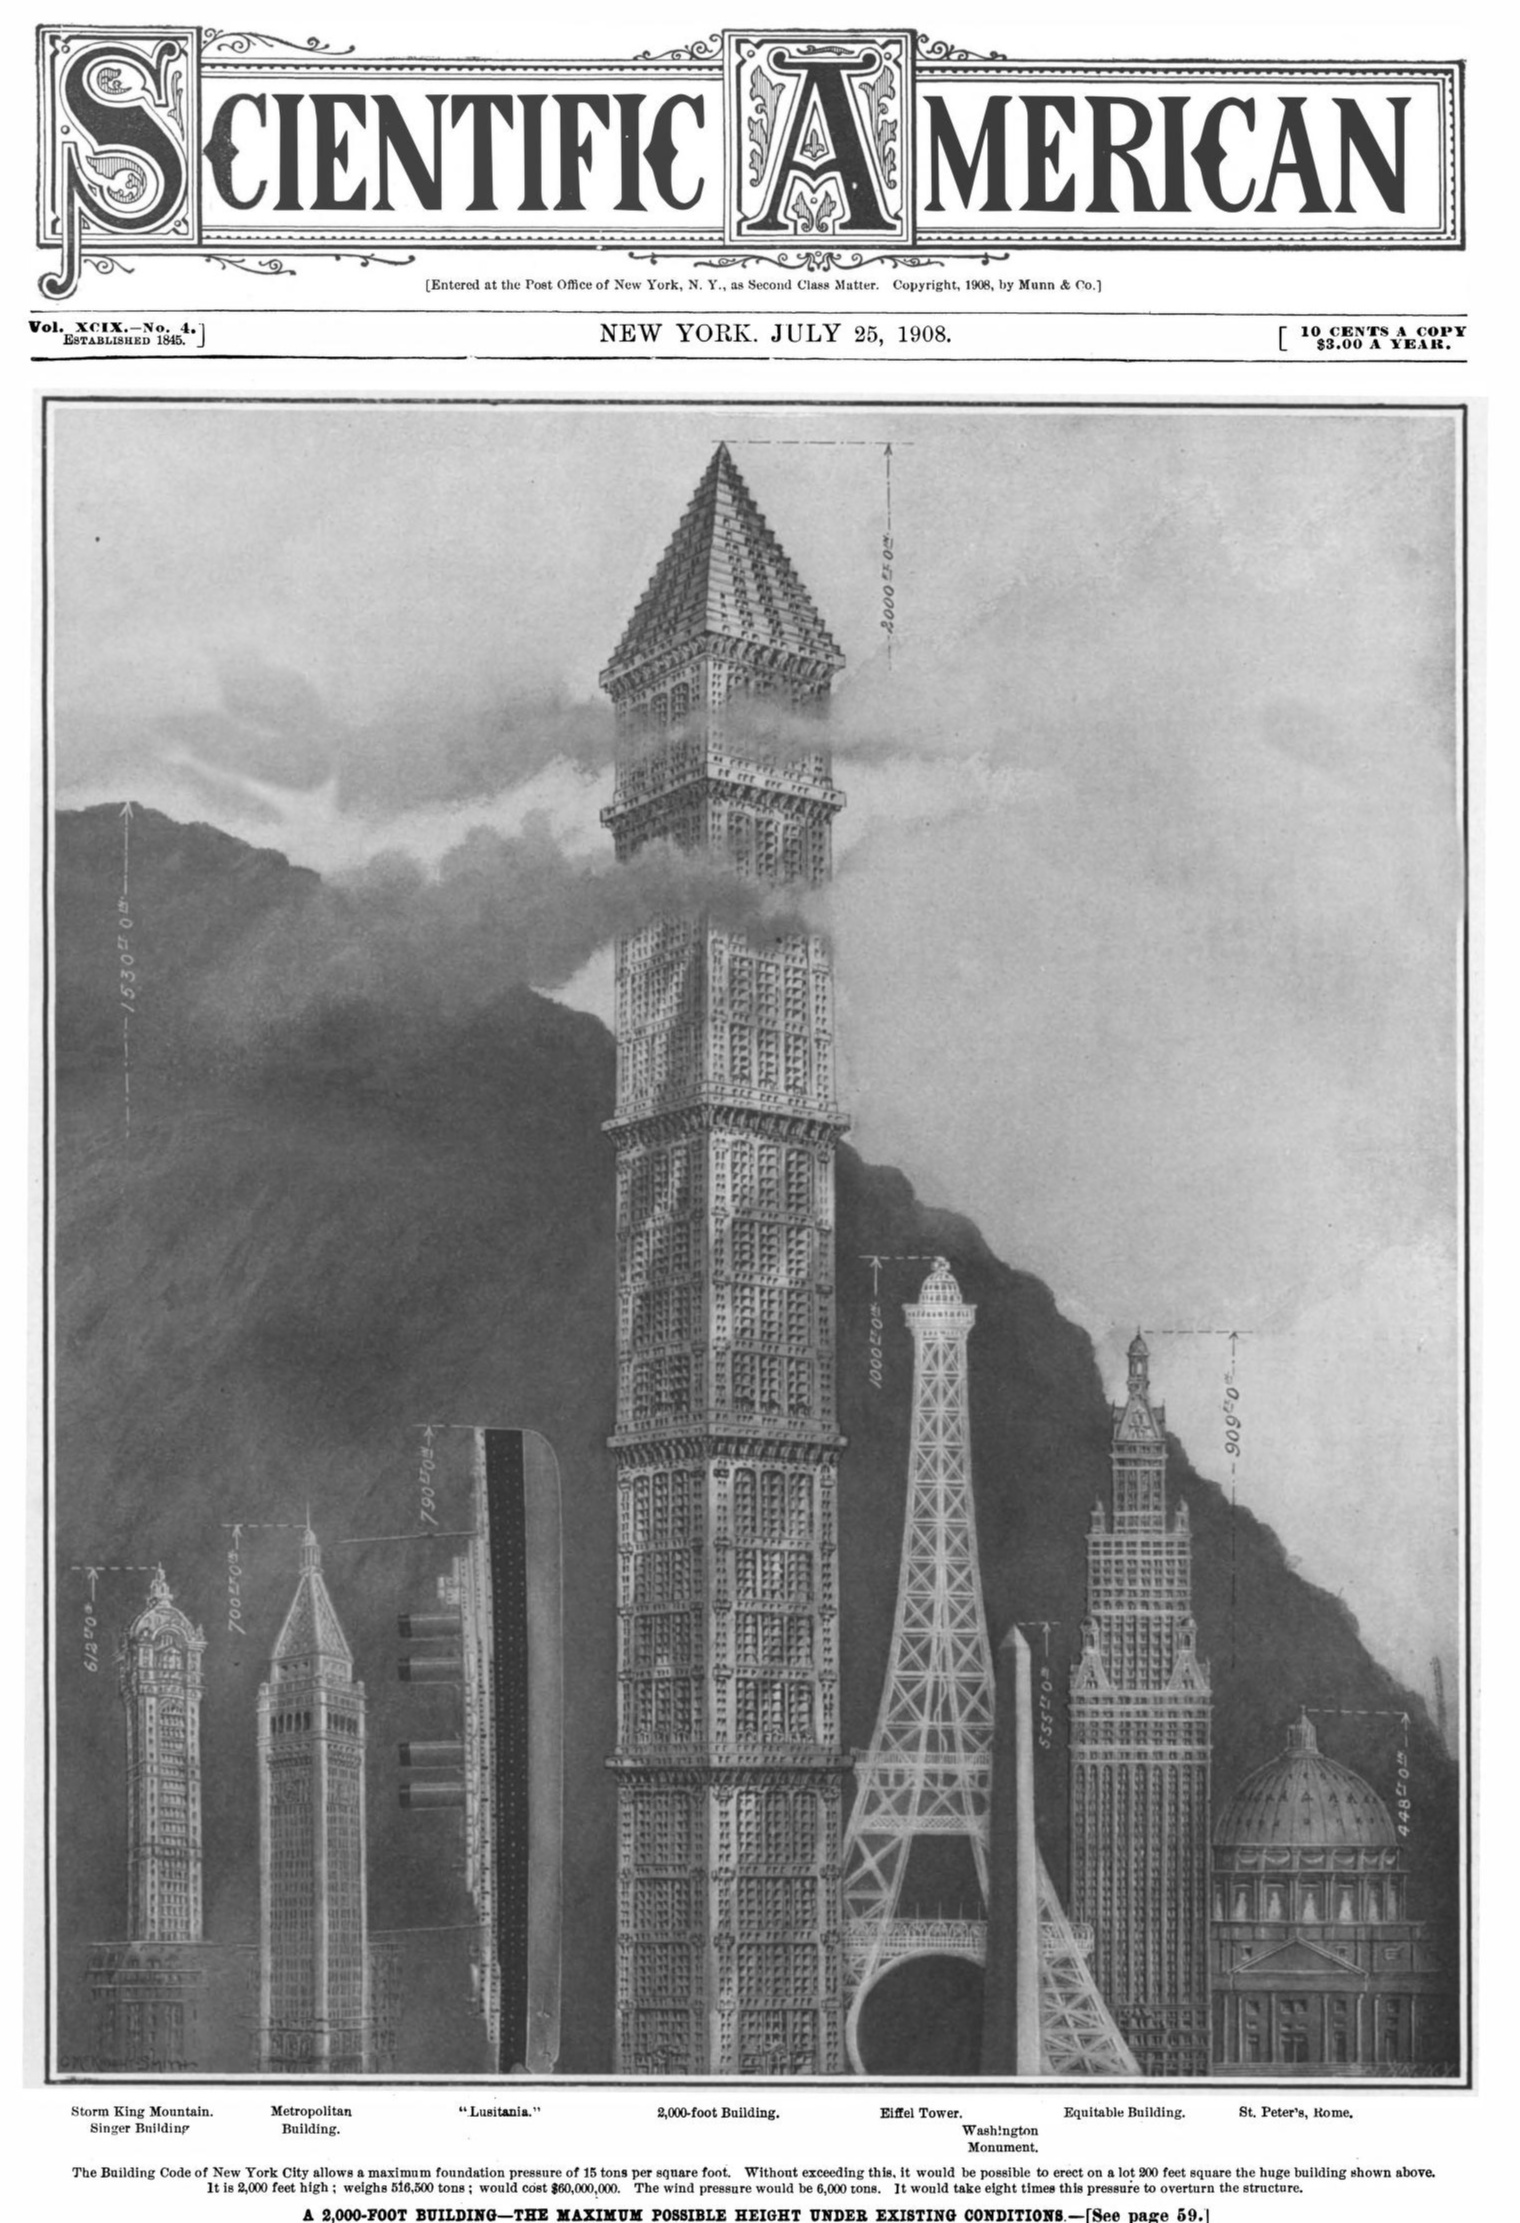
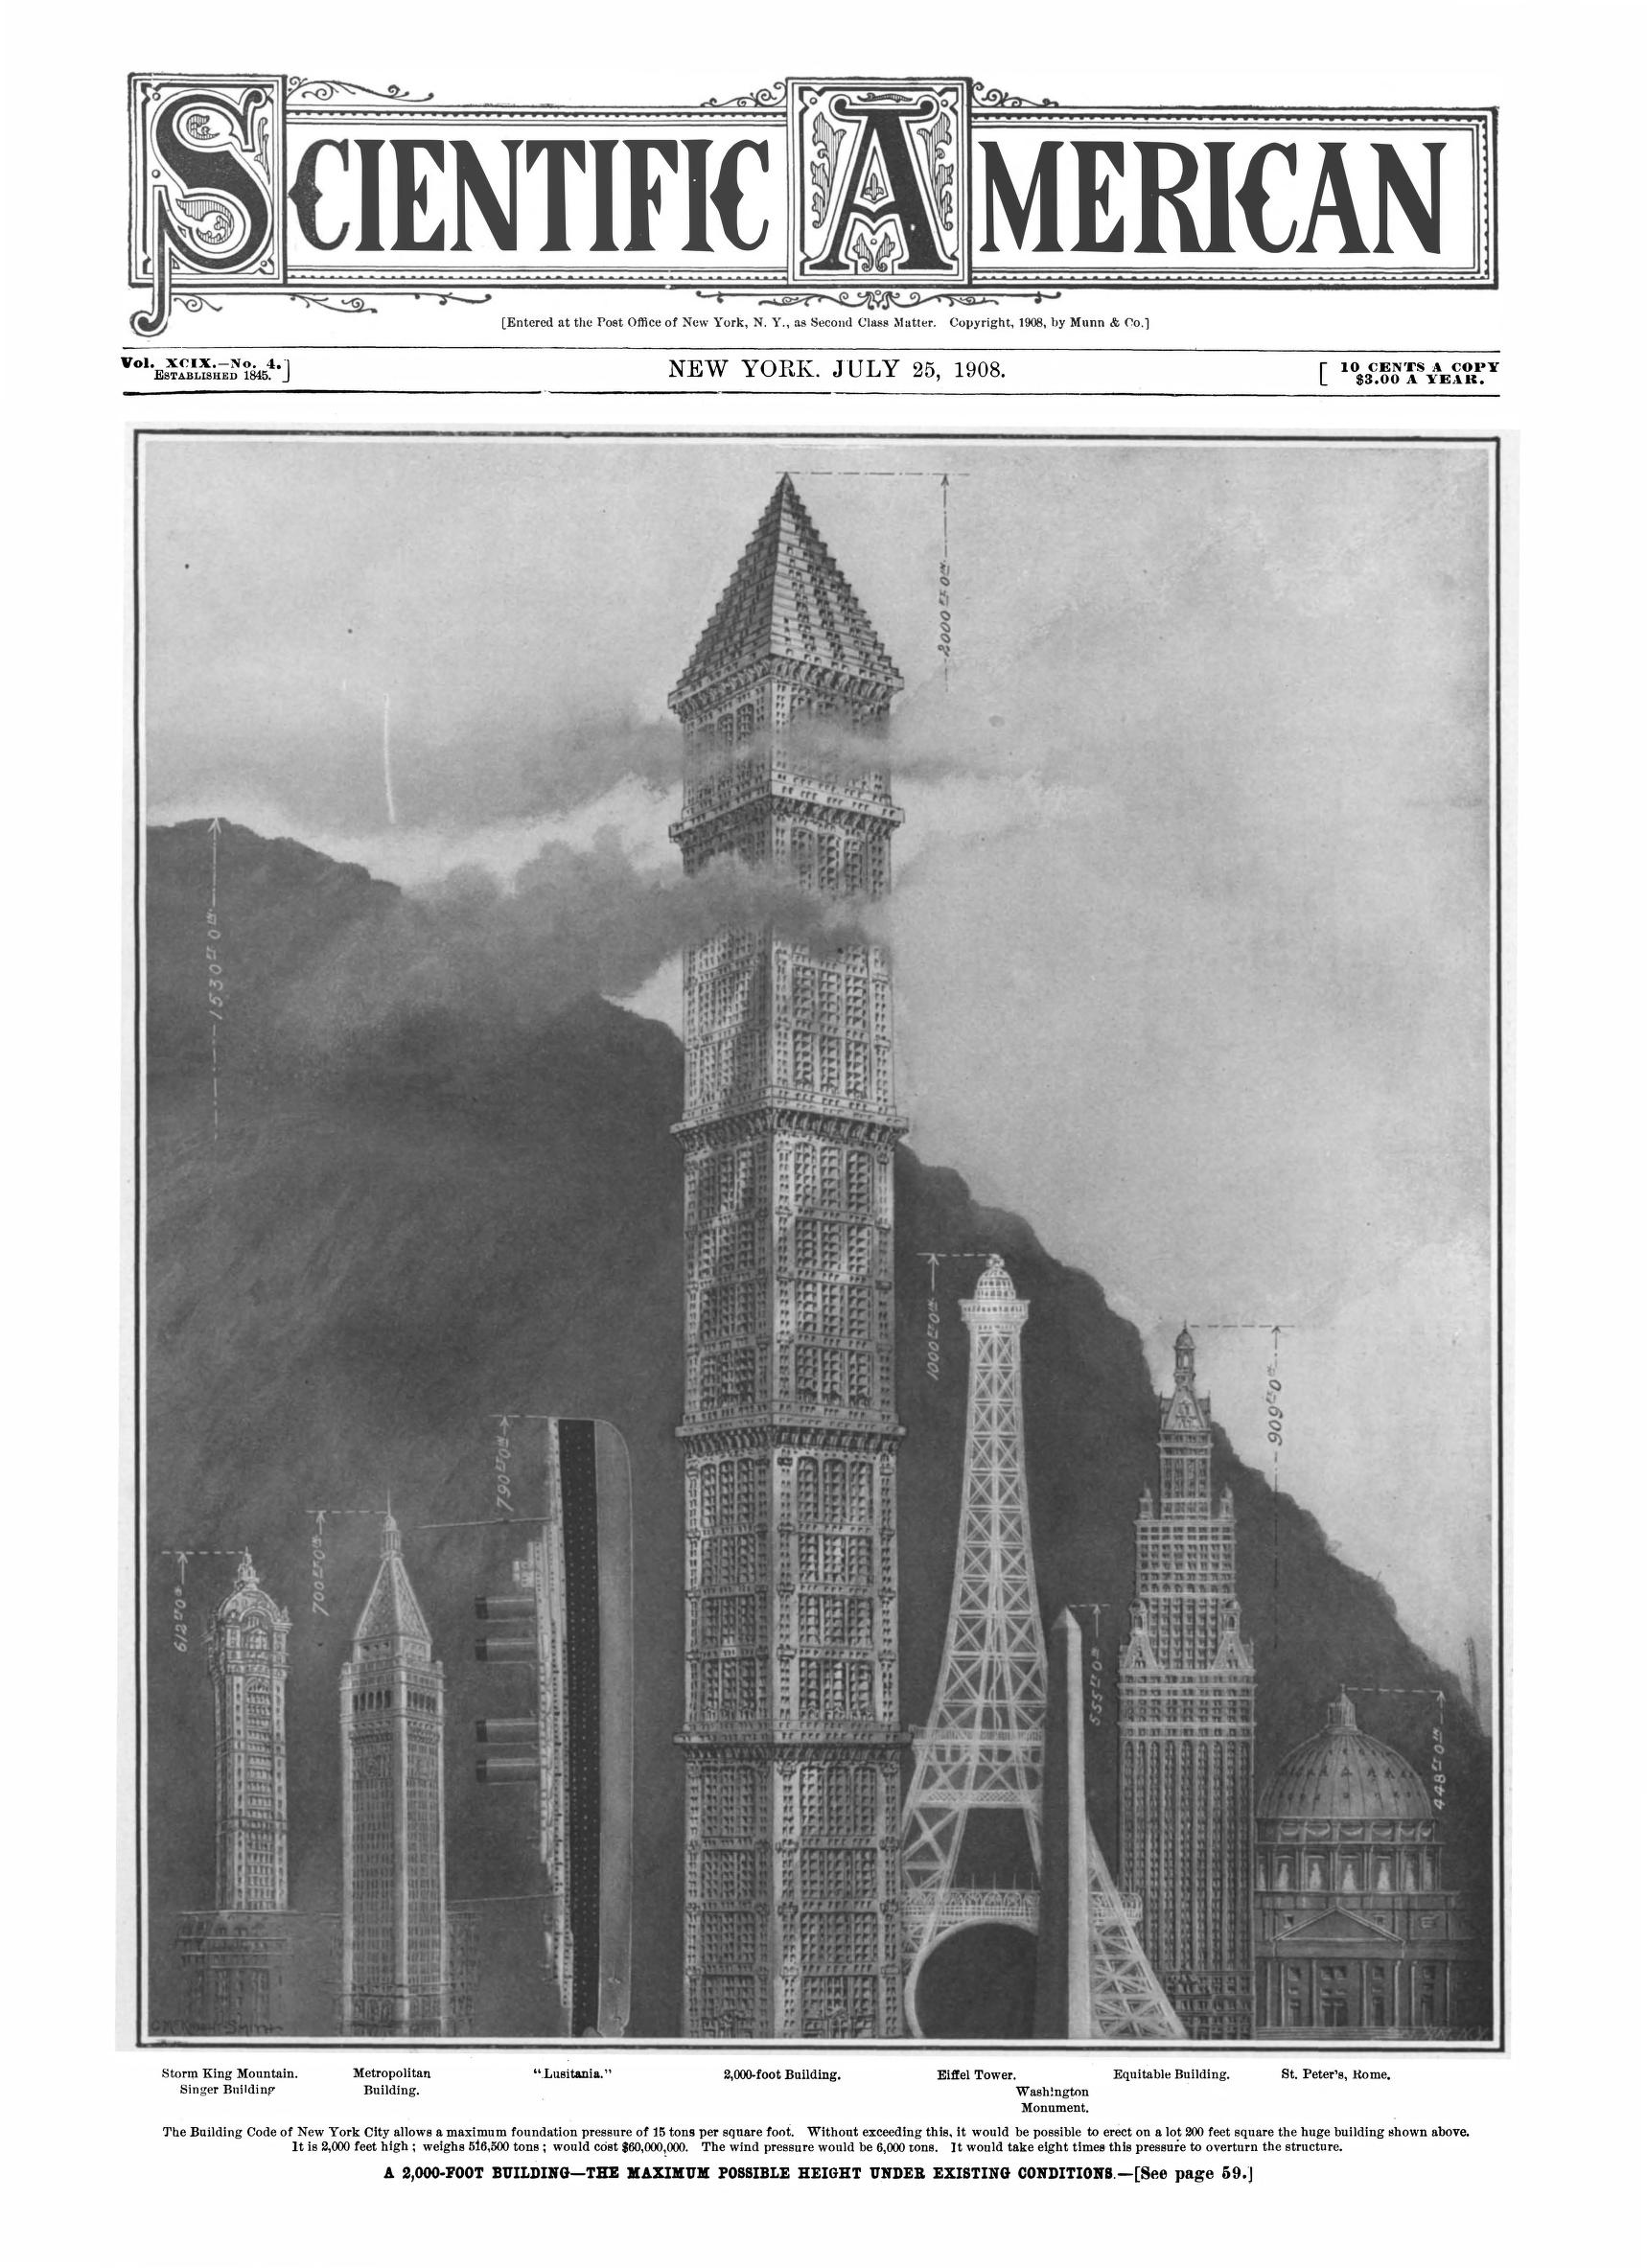
    I’ve lost track of the count of the sub-series on “Ships in the Skyline” in which new buildings etc. are measured against commonly-known objects, including large ocean liners. The enormous ship as measuring stick is interesting, and the appearance of the ship amidst buildings is very attractive in a Dadaist sort of way, as an artistic non sequitur. That said, here’s another example, this from the Scientific American for 25 July 1908,  showing what was estimated to be the maximum height (based on foundation and framing) of the still relatively-new architectural ideal of the skyscraper. 

    I guess I should identify what “new” means–here I’m talking about the third decade of the building, the first of which (for all intents and purposes) could be identified as William Jenney’s Home Insurance Building in Chicago in 1885, which was 10 stories and 138′ high. (There are couple of other earlier and qualified contenders for “first skyscraper”, but for here the Jenney building will work fine.)  There was a boomlet of skyscrapers in Chicago beginning in the 1890’s, and the beginning of the Golden Age/Building Boom around 1900, so by 1908 the building style was well established, though “skyscraper” as a word applied to buildings was only 20 years old. (According to the Oxford English Dictionary, the first use of the word for a building was preceded by its usage for a tall horse (1788), a tall bonnet (1800), a ship’s sail (1801), an exaggerated story (1840), and a  high-hit ball (1842), before it came to rest on a building in 1884 and 1889.)  The secular buildings were not taller than the non-secular ones (like the Rouen and Cologne cathedrals) until the early nineteen-oughts. 

    Anyway, here’s the image with a Beaux-Arts superbuilding: 

    Sci Am 1908 Ships in SKyline  2000 foot bldg


  • Ships in the Skyline, Part 11 (1904 and 1908)

    JF Ptak Science Books  Quick Post

    SHips in skyline collage

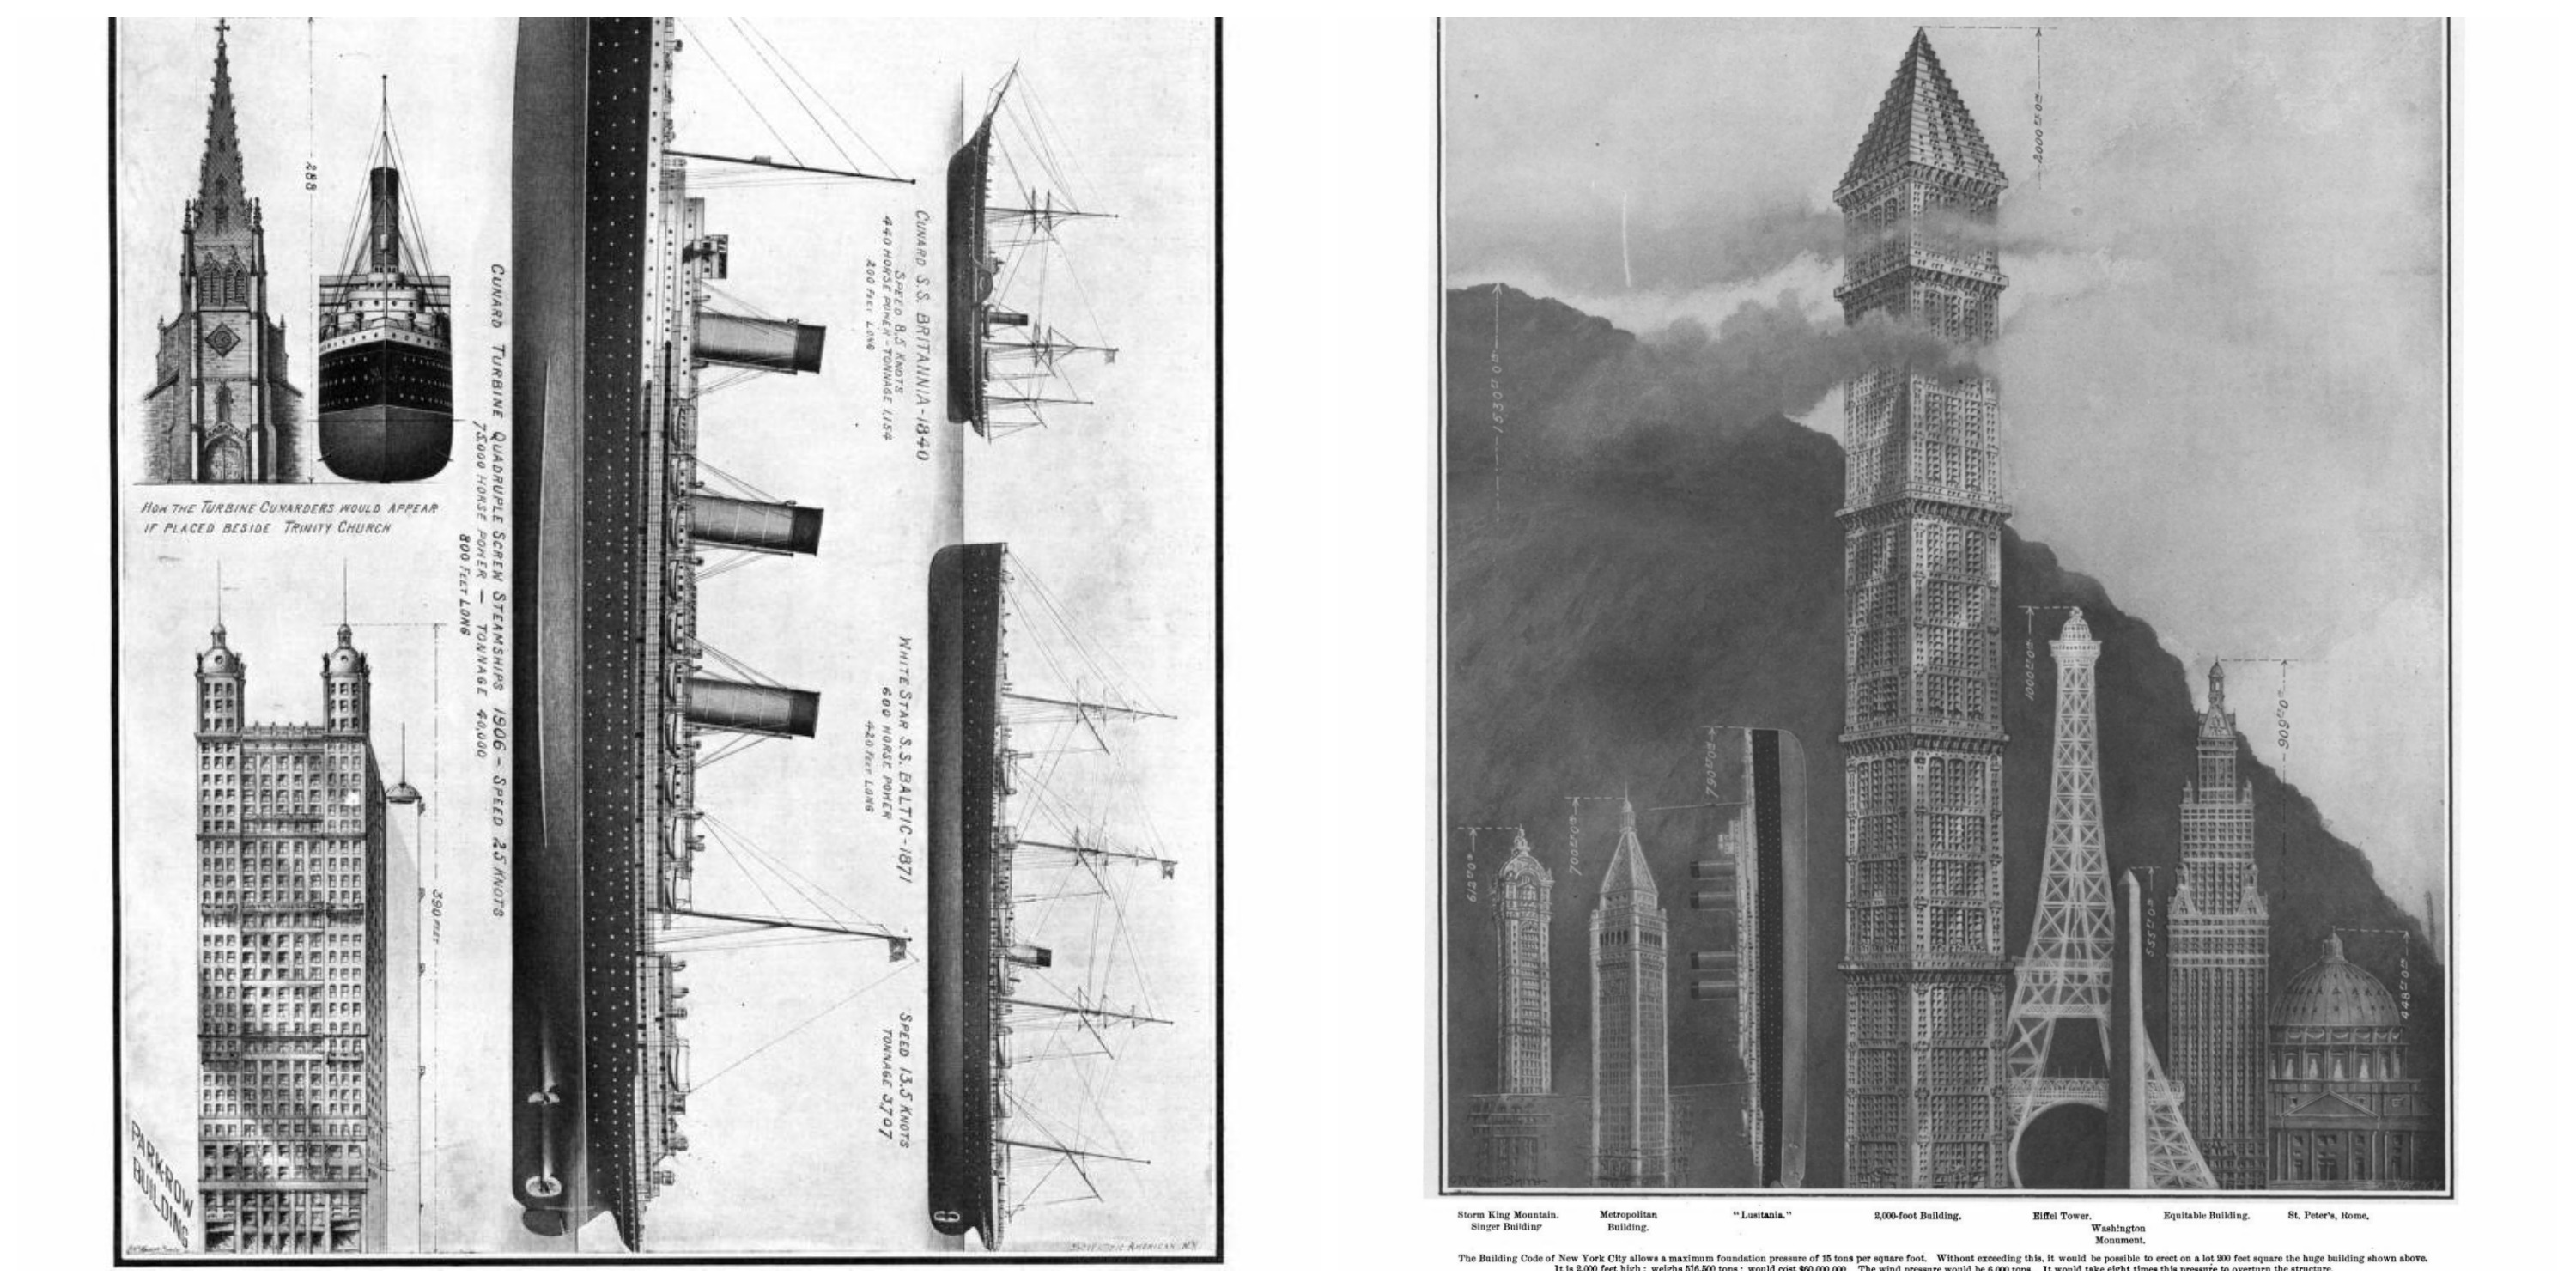
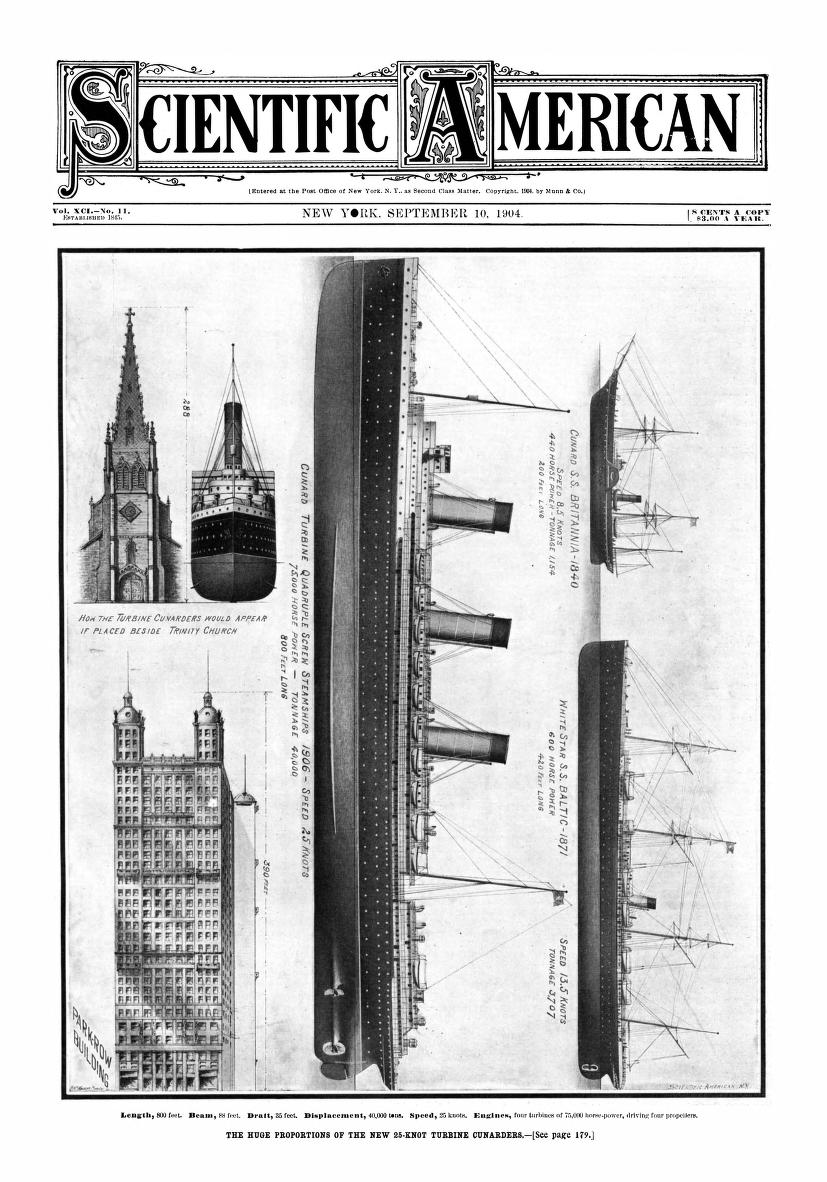
    In the continuing series of information presentation comparing new and relatively unknown objects to the very well known there is a subseries where the imagery uses ships as the new or the known, and they are usually presented in a city skyline or against a building. In the following two examples the first (Scientific American, September 1904) shows the new 800′ Turbine Cunard placed against Trinity Church and then, standing on end, impressively displayed alongside the 380′ Park Row Building, which at the time and until 1908 was the world’s tallest building. That means that the beautiful steel skyscraper designed by R.H. Robertson was not quite half the length of the new ocean liner, which also had the benefit of moving at 25-knots through the ocean whereas the Park Row, well, didn’t. In any event, it is a pretty interesting image.

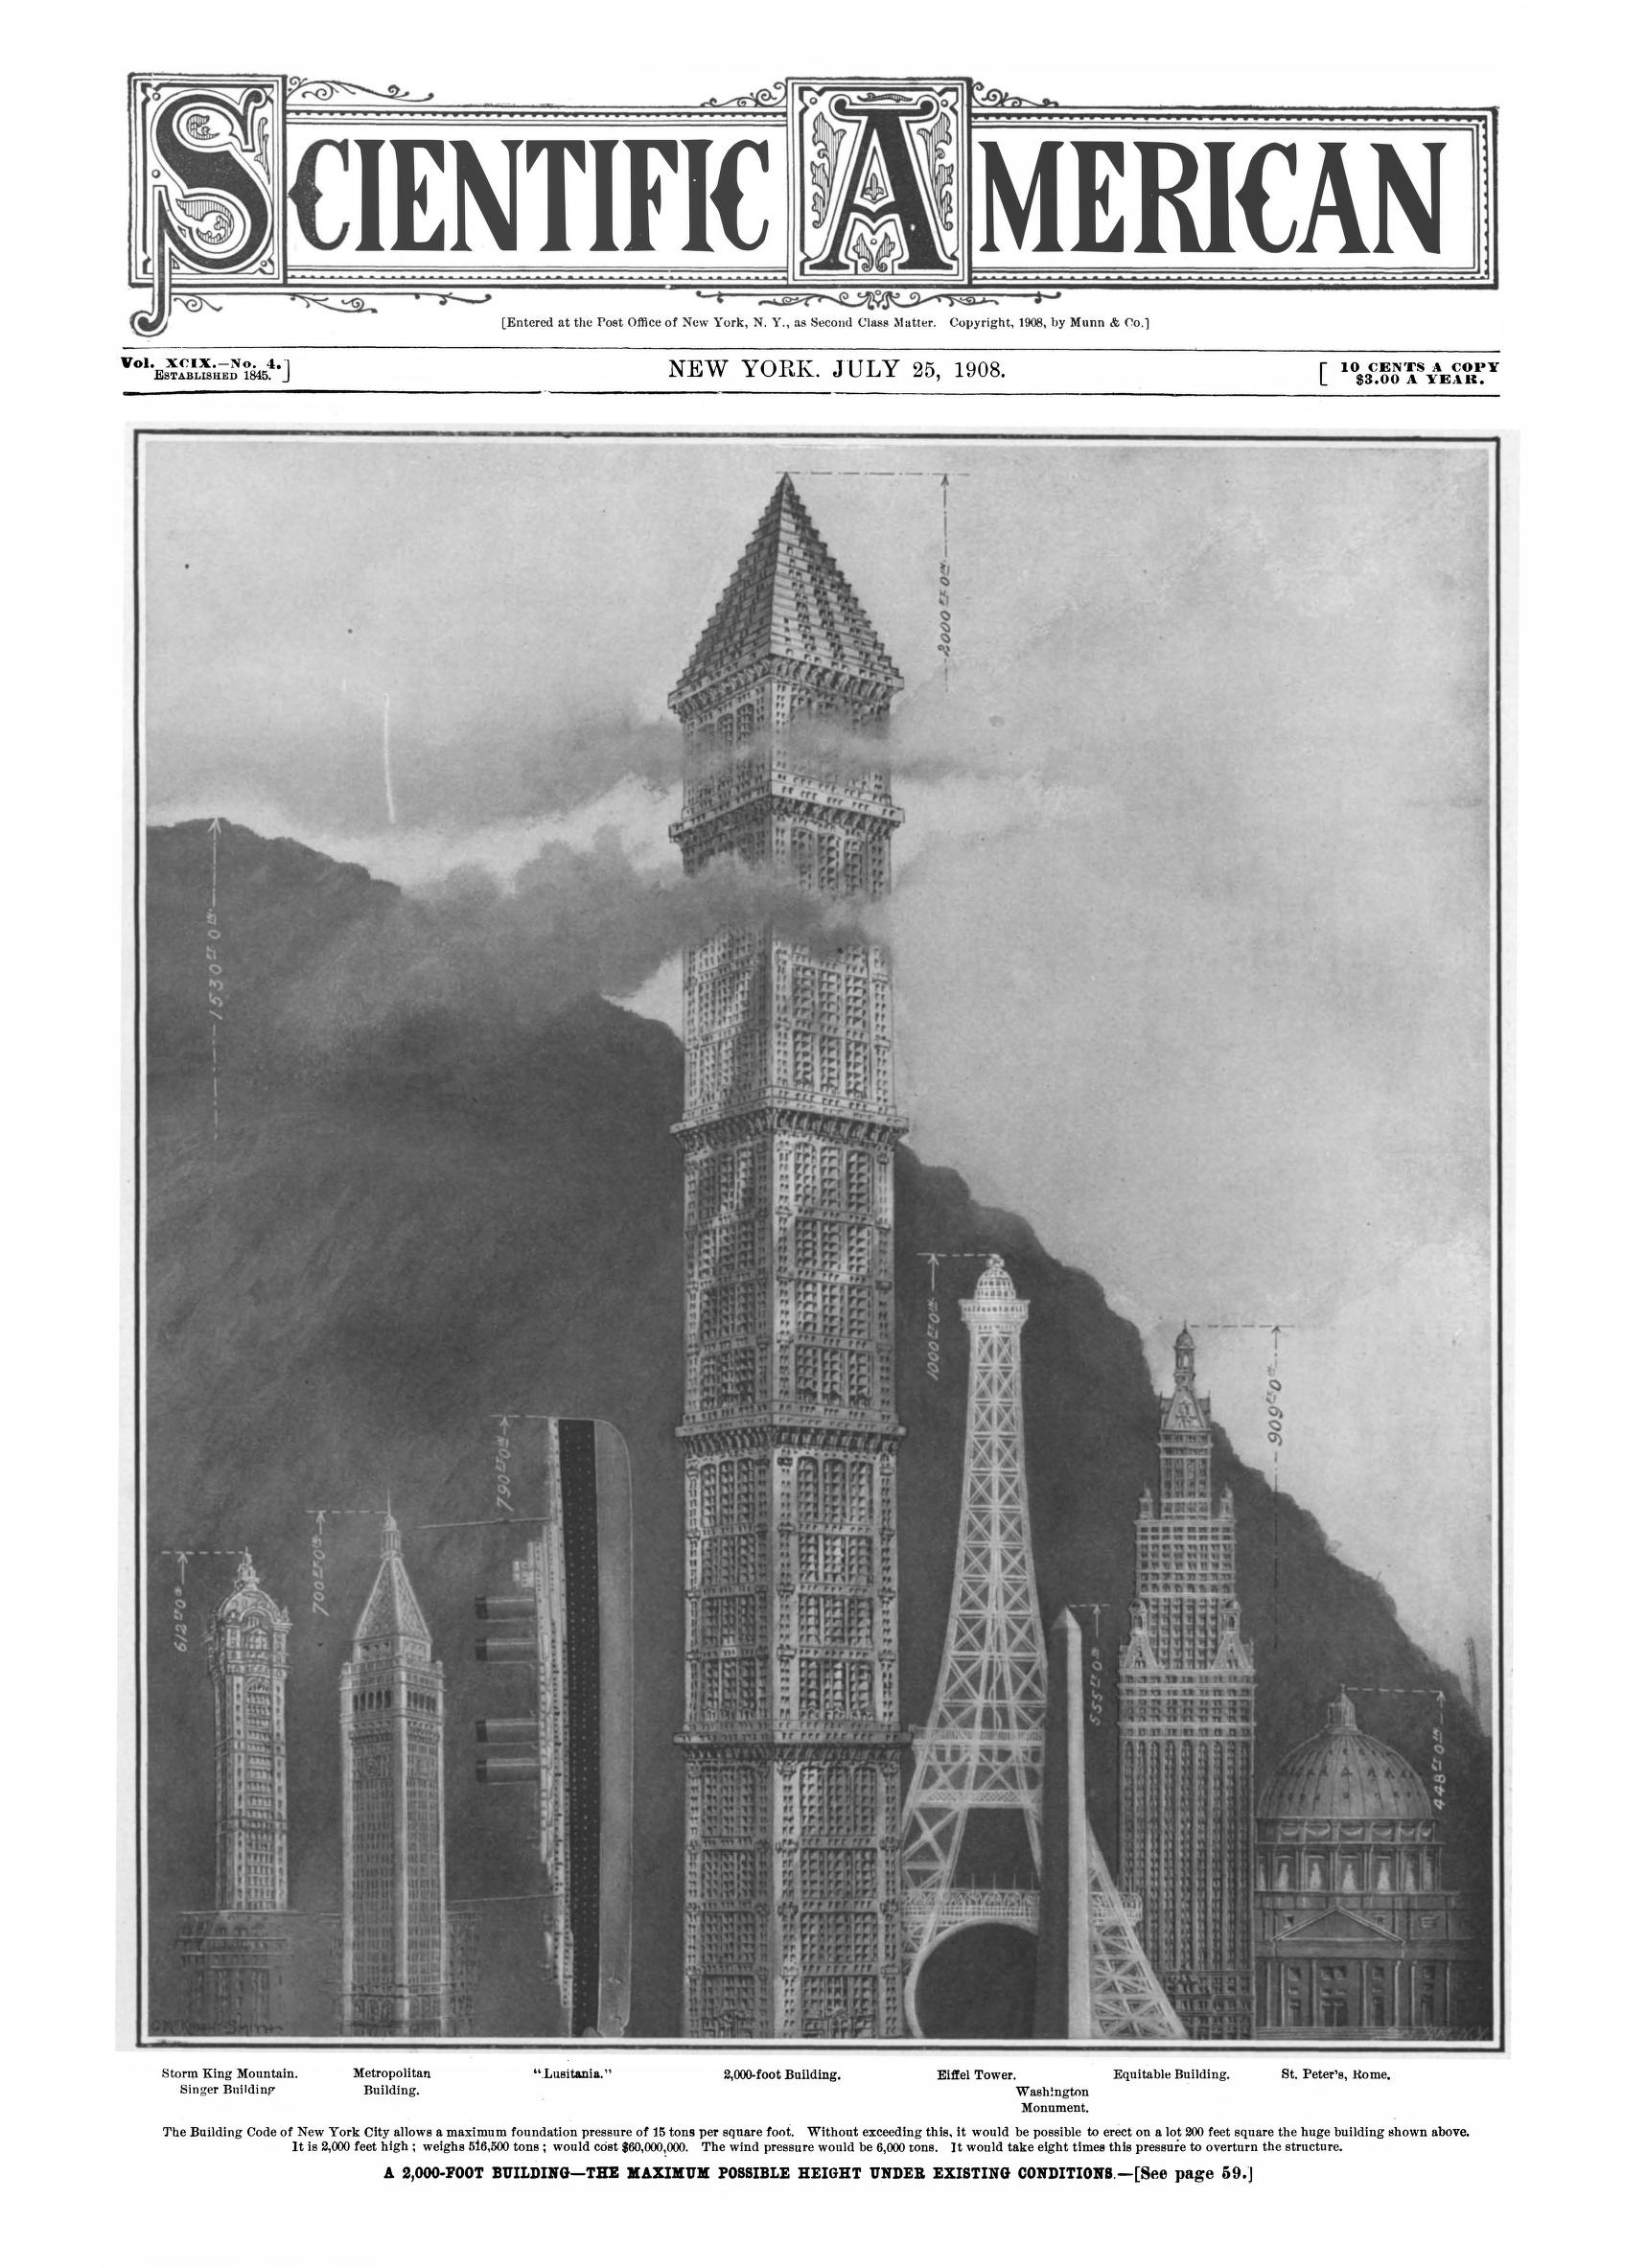
    The second (Sci Am 25 July 1908), compares what was thought to be the limits in the height of the still relatively new introduction of the skyscraper, which according to NYC building regulations listed the maximum foundation pressure at 15 tons per square foot. The editors of the Sci Am reckoned that you could build a 2,000′ tall structure under those conditions, and then compared this great beast to other tall buildings, plus the 790′ Luisitania, which was a very effective display. 

    Sci Am 1904 Sept Ships in Skyline

    Sci Am 1909 Ships in SKyline  2000 foot bldg