A Daily History of Holes, Dots, Lines, Science, History, Math, Physics, Art, the Unintentional Absurd, Architecture, Maps, Data Visualization, Blank and Missing Things, and so on. |1.6 million words, 7500 images, 4.9 million hits| Press & appearances in The Times, Le Figaro, Mensa, The Economist, The Guardian, Discovery News, Slate, Le Monde, Sci American Blogs, Le Pont, and many other places… 5000+ total posts since 2008.

Author: JF Ptak

  • A Few Polymathic Interesting Bits by Jevons

    JF Ptak Science Books  Post 2337

    Can We See More or Less than We Used To Be Able To See?

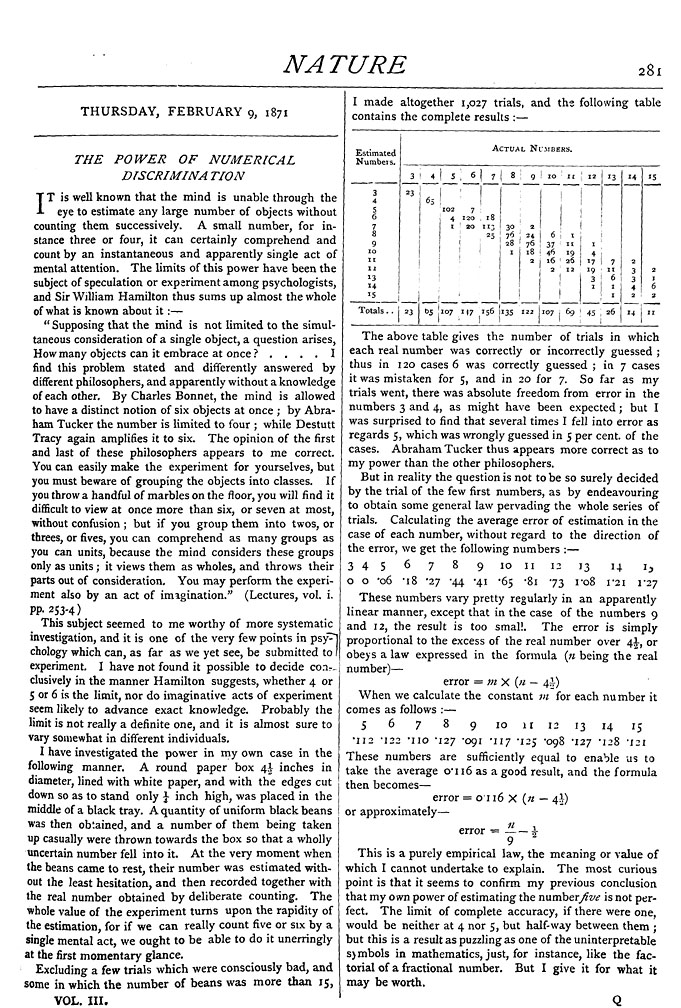
    An early study of attention and perception (or “How Many Items Can it Embrace at Once?”) popped out at me while muscling my way through another year of Nature magazine for 1871.  The article was by the polymatic W. Stanley Jevons (“The Power of Numerical Discrimination,” in Nature volume III, 1871)  who contributes an interesting and very early experimental bit on the success of the brain to correctly formulate an accurate memory when in a flash shown a number of items. (That is to say, when shown a certain group of X-number of items instantaneously and then removed, how often will the mind be able to remember the correct number upon recall–and without committing them to memory per se or counting them?) In this fascinating study Jevons records not only right/wrong answers but how “close” the remembered fit is to the original number, and in effect is a pioneering scientific effort towards understanding our abilities and limits in information processing. And as it turns out the ability to precisely recognize and remember groups of objects with success and without counting stops at about four items for the vast number of people texted. (It is another display of a famous four, including the four faces of Brahma, directions, Gospels, minute mile, playing card suits, seasons, corners of a square, virtues, color problem and of course four- letter words, to name a few.)
    Jevons numerical 1


    ·Posted by :

    ·in:


  • Verticals, War, Reims

    JF Ptak Science Books  

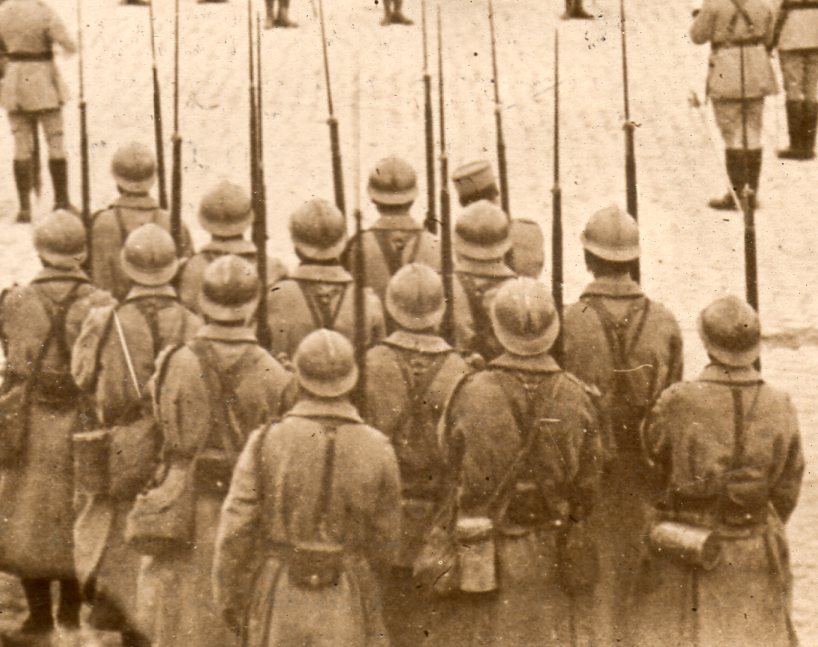
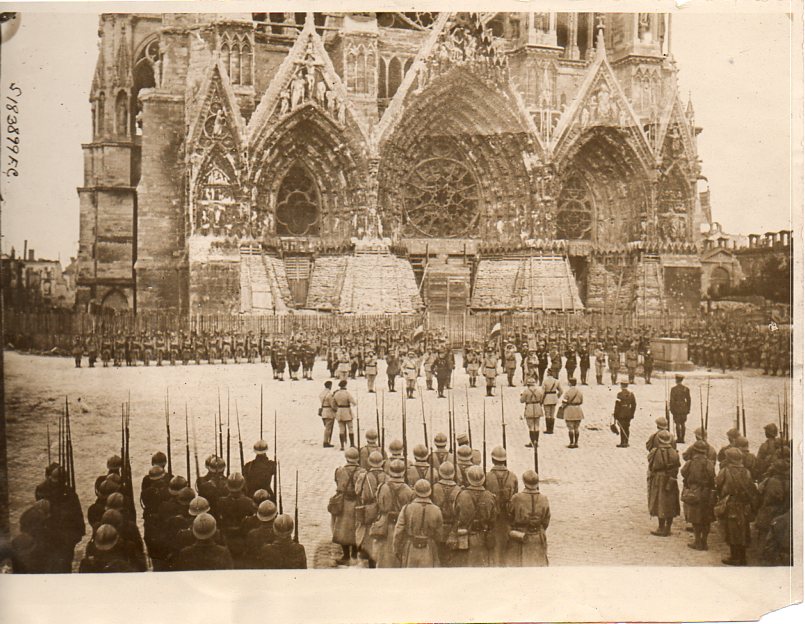
    In developing a history of vertical lines I thought that I would look at single vertical lines, but having just stumbled across this in our WWI News Photo Service archive, I just could not resist.  There is of course plenty of vertical arrangement here–just orders of magnitude more than what I was setting out to find.  So it goes.

    WWI photograph--spires071

    (The image is available from our blog bookstore, here.) And the detail:

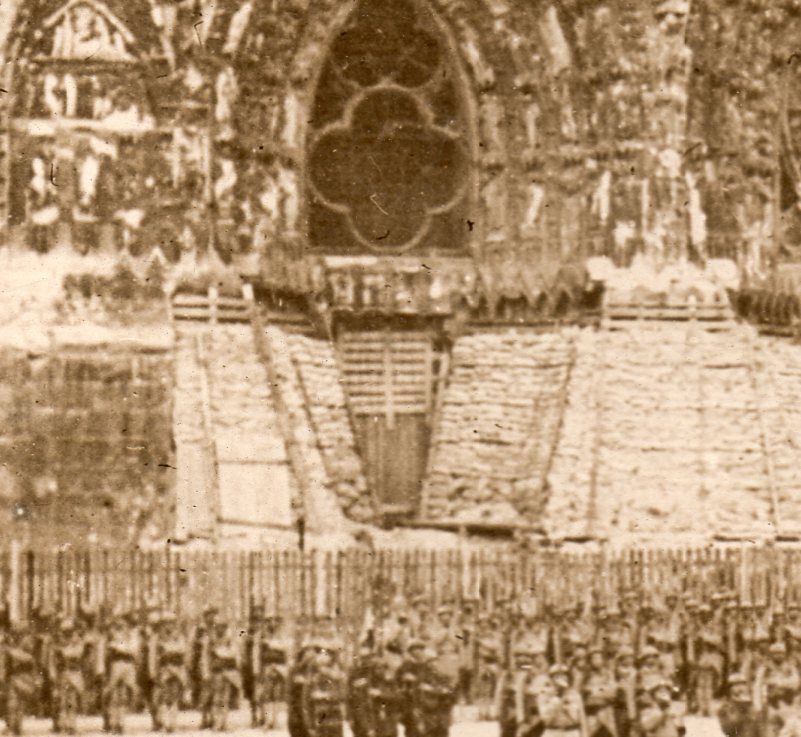
    WWI photograph--spires det072
     And another:

    WWI photograph--spires det073

    I find this a soaring image, in its own odd way–this is a celebration scene, after,all, a decoration exercise, a military display of French forces that liberated the town of Reims, all taking place in front of the battered cathedral. Notre-Dame de Reims was the place of the coronation of French kings, and was a spectacular 13th century structure built on top of other buildings stretching back the site’s inhabitation to at least the 5th century.  

    But German artillery shelling caught the cathedral right at the beginning of the war and very nearly wrecked it.  The building was badly damaged by fire, a fire caused by the Germans, which spread along the scaffolding on the building which fed the wooden supports and superstructures, the flames finding its way throughout the building.  The fire was hot enough to melt the lead in the roof, which poured down as molten rain and out of the mouth-spouts of the building’s gargoyles. 

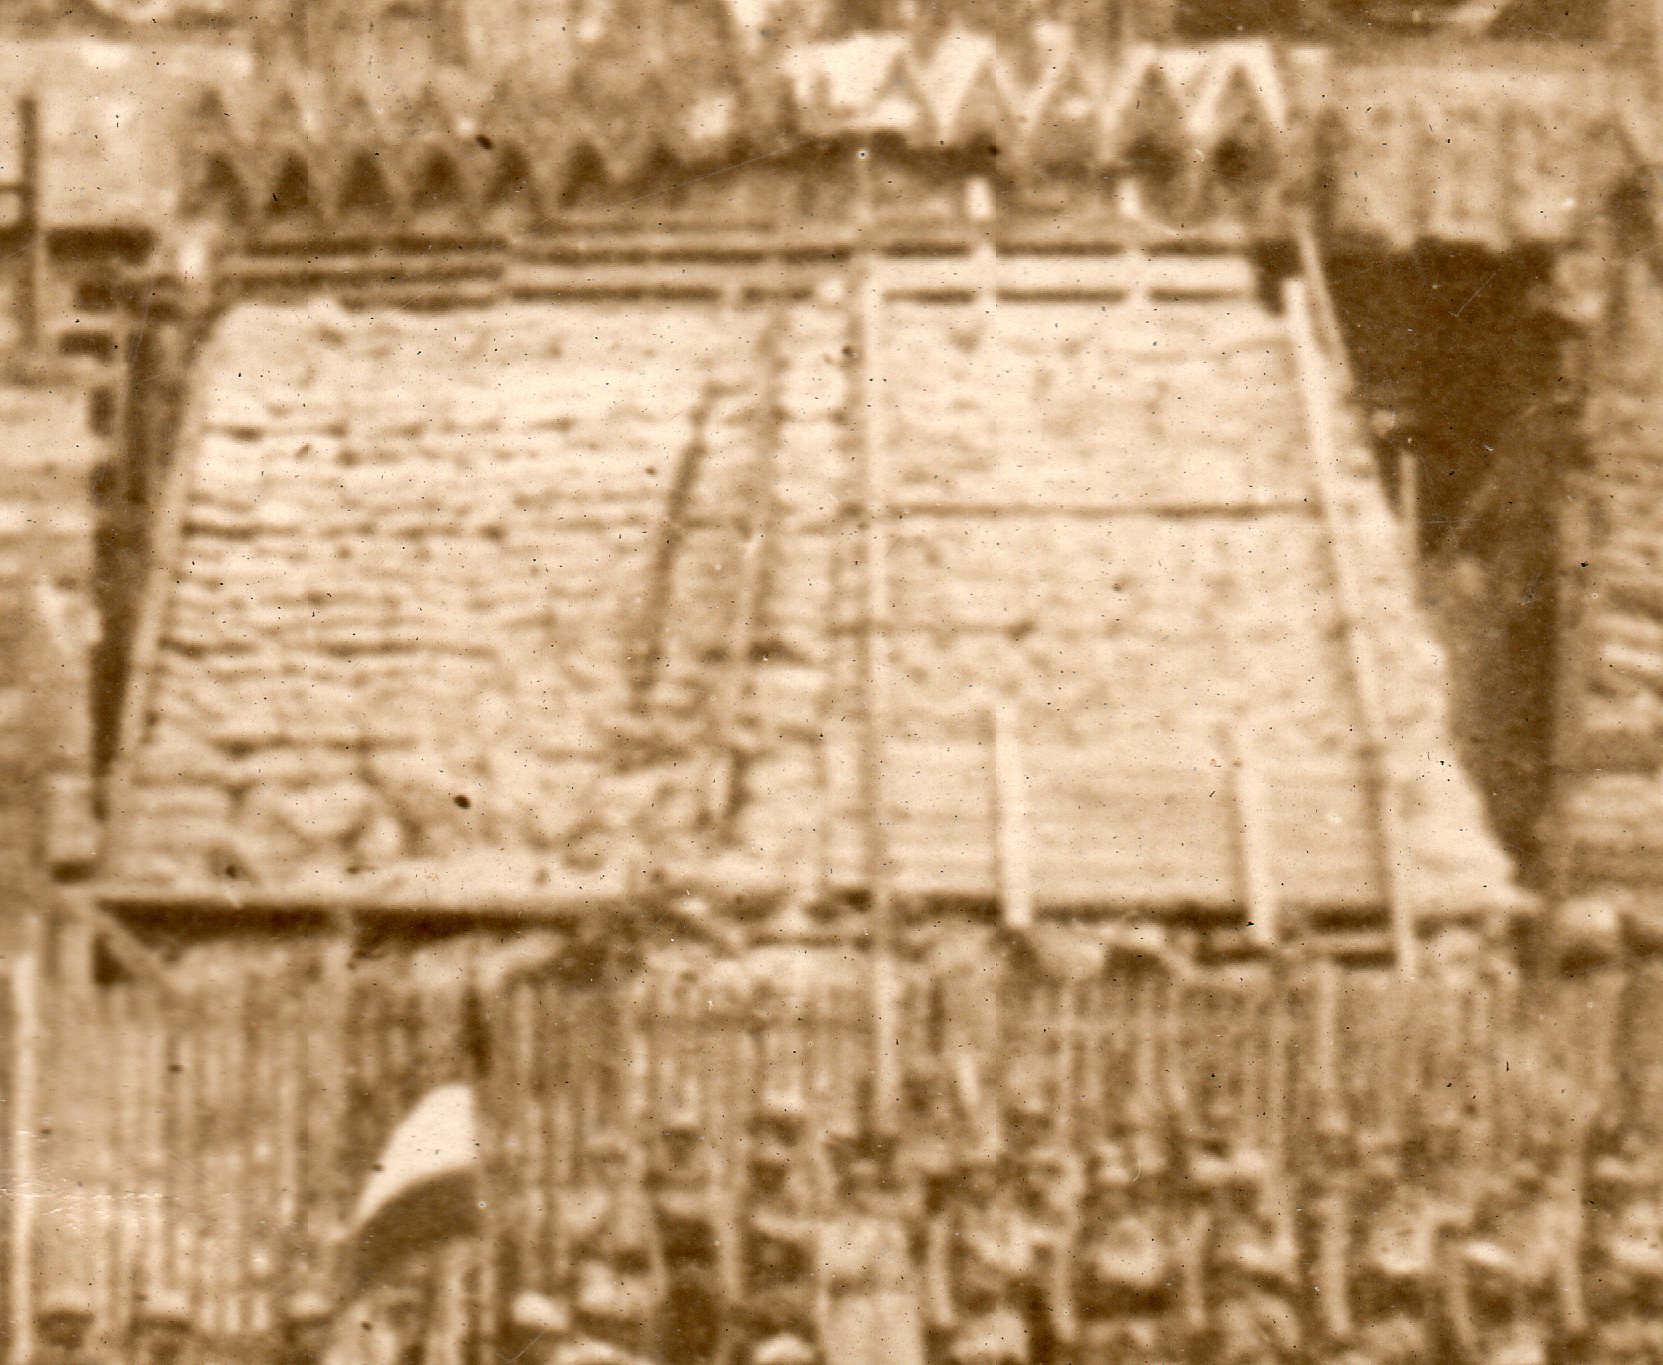
    As I brought out the further figures against the base of the cathedral one can clearly see the enormous stands of sandbags, the piles stacked up twenty feet or so behind the makeshift wooden fence.  IT was some sort of protection for the building, but not muc. 

    WWI photograph--spires det074

    This was yet another battle for the city, this one taking place 1550 years or so after the first, the Alemanni defending against the Romans; and then 104 years after the next major encounter, this between Napoleon and a Russian/Prussian force.  The liberating battle (the Battle of Reims, or the Second Battle of the Marne) took place 15 July 1918 to 6 August 1918, and it was a major failure for the German army, and spelled the collapse of the Spring Offensive, opening the door to the end of the war.  There were more than 135,000 Allies killed or wounded in this campaign (including 95,000 french troops), plus another 130,000 German troops.

    The process of victory in front of the wounded church seems exhausting and exhilarating, but not without a good sense of anticipation.

    ·Posted by :

    ·in:

    —

  • History of Mattresses: the Suspended Sleep of the Atomic Bomb, 1945

    JF Ptak Science Books    Post 2336

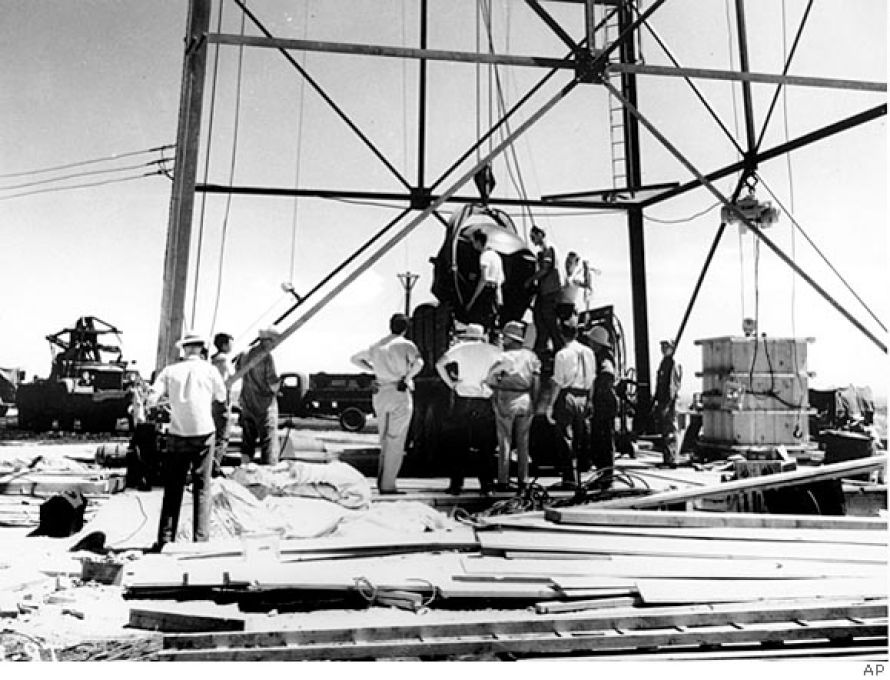
    Atomic bomb trinity tower[The preparation of the bomb, at center, before being quite armed and hoisted–(AP Photo/File)]

    The “Princess and the Pea” comes to mind with this story, except that the pea was located above the mattresses, suspended from cable above them. It was the ultimate pea.

    That “pea” was an atomic bomb. It was suspended in inside a 100-foot tall metal tower in the desert of Alamagordo, in the Jornado del Muerto, the test shot to see if the bomb worked, the near-culmination of the work of 100,000 people and billions of dollars, and the great potential decision-maker on the outcome of WWII

    This was the Trinity Test–July 16, 1945. 

    The bomb was hauled up to its position in the tower, dangling there, not much protected from the elements which that night of the test threatened lightning and wind.  What of the cables failed? And the bomb fell?  

    The last-minute fail safe was a large pile of mattresses.  They would cushion the fall.  The bomb would not explode, but it could be heavily damaged. And in this makeshift way the enormous investment was protected.

    The bomb was detonated at 5:29 that morning, creating at 1100′-wide crater, causing the atmosphere around the explosion to turn blue from heavy radiation, and raising a 40,000′-tall mountain of smoke, a result of its 15kt yield.

    The tower of course was vaporized.

    I assumed too so were the mattresses–even if they were Army-issue.  

    It is a secret irony of some sort that while pre-detonation betting was going on by the scientists about the yield of the device with a side wager on whether or not the atmosphere would be set on fire, that the stop gap measure preotecting the bomb if it fell was a pile of mattresses.  

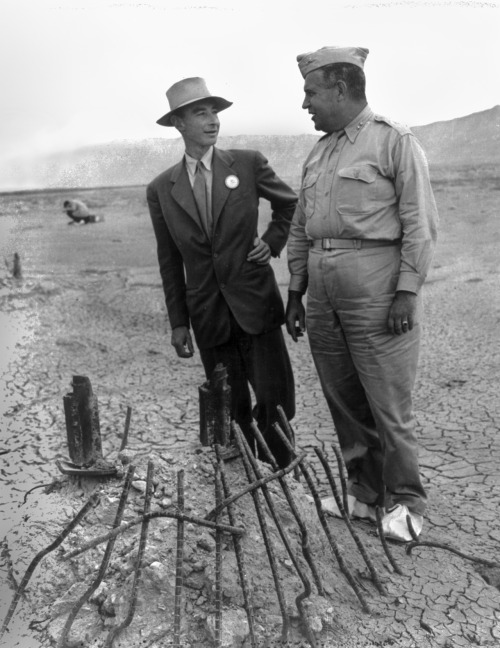
    Atomic bomb trinity oppenheimer groves

    [Oppenheimer and General Groves–standing too close for comfort–at the footings of the dissolved tower, afterwards, their whie footies in place for radiation protection.]

    But it all worked out.  

    ·Posted by :

    ·in:


  • How and Where Unwanted Fires Started in London,1836

    JF Ptak Science Books  Post 2334

     I’m pretty sure that I’ve not seen statistics on the origins and causes of fires in William IV’s London of 1836…probably the need for the numbers has never come up, nor has their serendipitous discovery.  I have been interested distantly in firefighting techniques in earlier times, especially in places like London and Amsterdam, (and especially in reaching upper floors of narrow tall buildings), but the occurrence and frequency part never came up out of the technical interest in the firefighting tools.  

    But in this article on firefighting gear (depicted in the previous post, referencing The Mechanics’ Magazine, Museum, Register, Journal, and Gazette, Volume 26, 1837) several pages in were these captivating numbers–they all seem to make sense, though overall seeing them together led to an overall feeling of surprise.

    For example, of the 564 recorded and responded-to fires the two top causes were chimney fires (72 cases of the 564) and “bed-curtains set on fire” with 71.  It is not clear to me what this means, but I’m guessing it had to do with having a bed too close to a fire, or perhaps coals were dropped somehow from a bedwarmer.  A related cause was incautiopusly hung linens in front of fires (31), gas (38), candles (51), stoves (28), and so on. 


    The list of the places that caught fire is fascinating in itself.  Most of the businesses no longer exist as sole entities, or if they do (for a business like ‘coach making”) they exist in very small numbers for a very specific and tiny niche market.  That said most of the fires were in private houses (211 of the 564 reported incidents) followed by victuallers (36, and I suppose in this case the word relates to anyone selling food, as in a pub or inn), lodging houses (35), carpenter shops (26), “shops, office &c.” (23), bakeries (20), bookshops and stationers (12), and so on down the list. 

    Then there are the other low-occasion fires in fascinating-sounding places, like straw-bonnet shops, feather merchants, cheesemongers, silk-weavers, oil-and-colourmen”, and others, not the least of which were the Lucifer-match-makers.  

    All fascinating, really. 


     And somehow there was only one case of fire caused by tobacco smoking–I mean cigarettes basically didn’t exist yet and especially so ion mass-produced form so there were no rolls of tobacco product enclosed with paper impregnated with chemicals to ensure that the ciggie will burn whether someone puffs or not–which is odd because it was still a fairly wide-spread habit in pipe-smoked form…still with the caveats it is a funny statistic. And I guess there was one case because so many others couldn’t be confirmed to point of origin because everything got burned up.  Or something along those lines.  


  • Fighting Fire with Fire, 1837

    JF Ptak Science Books   Quick Post

     [Image source:  Google Books, The Mechanics’ Magazine, Museum, Register, Journal, and Gazette, Volume 26, 1837.]

     This remarkable fire-fighting suit was present in an article in the prestigious Mechanics’ Magazine, and published in London in 1837.  It does seem impossible in its way to the modern reader, particularly for the eye-popping hood and lighted-candle-belt apparatus.  But it is very sobering to think that this would have been a vast step-up from what was available at the time–especially for the leader house of air into the jacket/hood.  Here’s the full text of the description of the apparel:


  • Feeding the London Zoo in Terms of 1944 Telephone Operators

    JF Ptak Science Books    (3,000+ total posts, including Quick Posts)

    I’ve put together a relatively large collection of images from 1850-1940 which are graphic comparisons of data and graphical displays of quantitative information..  In general they display the basic concepts of one idea in terms of something else, or they simply exhibit the idea or concept in cold hard one-to-one images.  The two images below are good interesting, standard representations of these categories.

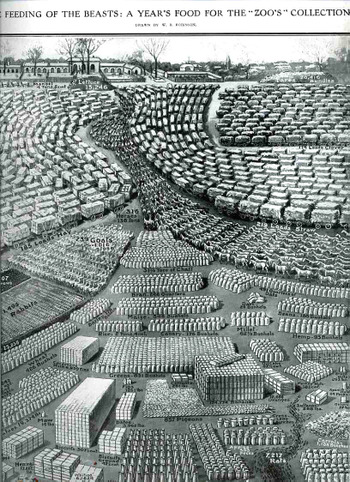
    Zoo_story149_2

    The first is a very neat and complex display of the food eaten by animals in the London Zoo and was published in the Illustrated London News on May 17, 1913.   The data, found in the report of the Zoological Society of London (for the year 1912) is entitled “The Feeding of the Beasts:  a Year’s Food fore the “Zoo’s” Collection.  The real story though is in the subtitle:  “from shrimps to rats; from onions to oil cakes and mice, the food consumed by the animals at the “zoo” during 1912.    (I’m assuming that the word “zoo” is in quotations as it is a diminutive of “Zoological”, ad was seen as slangish.)  As you can see the language of the undoubtedly stiff report is beautifully brought to life (but not for long) in this work by W.B. Robinson.
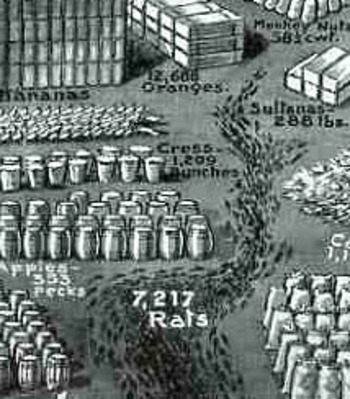
    Zoo_story_rats_2
       
    We see 15,000 pounds of lettuce in a lump and a pile of 4,220 bunches of carrots, along with a serpentine 185 wagons of hay and a snaking 219 wagons of straw; there are giant cubes of biscuits and milk tins, and an even larger cube of 183,000 bananas in boxes; there are orderly armies of goats and rabbits, and a very neat ordering of 19,000 pounds of potatoes in stiff white sacks.  At bottom we see comparatively lonely contingent of 28 ducks (undoubtedly hoping that something else besides what was happening was happening); and of course an ant-like column of 7,217 rats. There were also masses of clover, boxes of sparrows, 857 pigeons, 123 pounds of figs, 2 tons of dates, 93 bushels of hemp, 4500 pounds of grapes, 500 pounds of sugar (?), 34,000 eggs, and a slithering line of 25,000 mice.  Most disturbing though is the central figure of a long, quiet column of 318 horses.  I can’t help but feel sorry for them.  It is a remarkable and successful effort to put the data into a form that was somewhat more understandable, if less digestible, and a little more heinous.
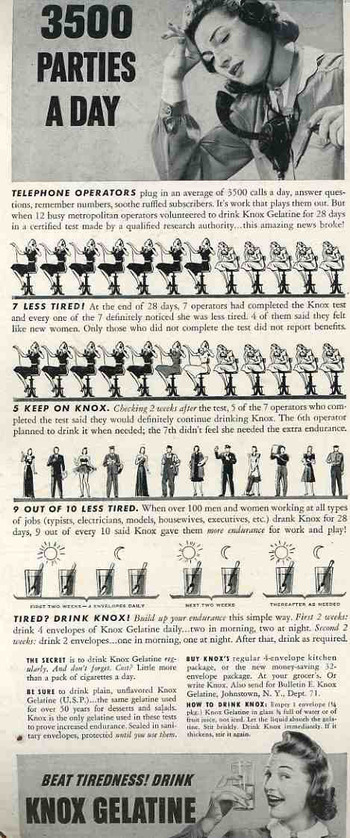
    Telephone_ops150

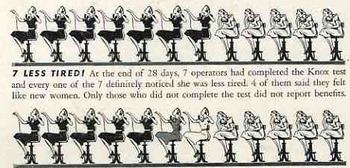
    The second image is a simple but somewhat bizarre rendering, changing counting units of numerals and replacing them with telephone operators—I can honestly say that I haven’t seen this before.  It is quietly bizarre, but still quite effective in making the sales pitch for the noxious element.
    Telephone_ops150_detail


  • History of Lines: the Big Little Lines of Richard Feynman (1949)

    JF Ptak Science Books   Post 2333

    Perhaps the only bigger five put-together lines than Feynman diagrams may be home plate; otherwise I’m hard pressed to come up with a better thing that can be drawn in this way with this many lines.  

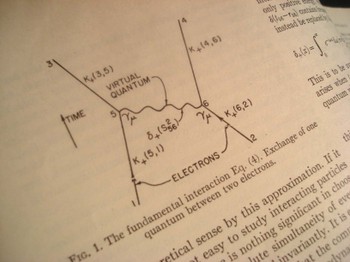
    The impossibly smart Richard Feynman (1918-1988, Nobel in 1955 for the development of quantum electrodynamics; physics of superfluidity; path integral formulation of QM, etc.) worked on a schematic that would  visualize quantum electrodynamical interactions, the scattering calculations in QFT describing interactions between particles The result is known by nearly everyone on earth as Feynman diagrams. (Murray Gell-Mann, another Nobelist and ueber diligent partner and competitor of Feynman’s, and perhaps as influential a physicist (with the Eightfold Way and etc.), refers to the diagrams as (Ernst) Stuckelberg diagrams, named for a once-obscure physicist who, among others, came up with an early schemata closely resembling Feynman diagrams.)  They are an elegant and powerful redistribution of complex arrangements that are more easily calculated when visualized.


    Dsc00016

    The images here are the first time the diagrams were published, and are found in the 15 September 1949 issue of the Physical Review after having been introduced in conference and class work (at Cornell int eh 1948/1949 QED course that Feynman taught there). They are among the top-10 prettiest pictures in physics of the 20th century.

    Their descriptive power is matched only by their crystalline simplicity—few diagrams have ever been constructed with a greater claim.

    Dsc00015


    ·Posted by :

    ·in:

    —

  • The Computational Future-World of 1902, a Dozen Years Old

    JF Ptak Science Books

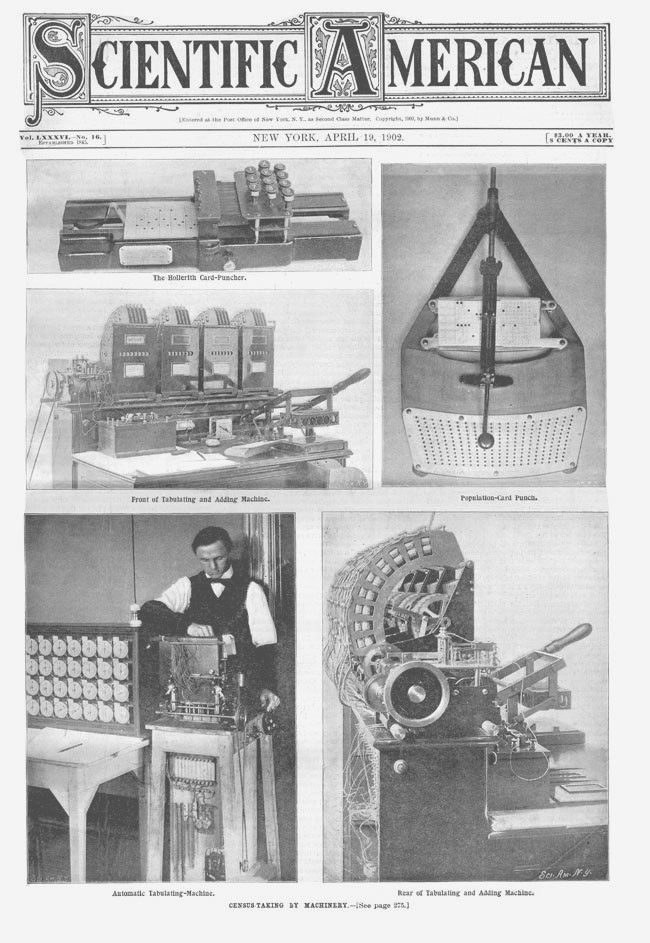
    This is sort of what the future of tabulation looked like in 1902–except that the people in this year were already living in this tabulating future, surprisingly already a dozen years old at this point. The cover illustrates an article on the machinery used in the production of statistics and tables and general data organization by the great work by Herman Hollerith, who had already performed this function for the U.S. Census of 1890.  (Hollerith had offices at Wisconsin Avenue and the C & O Canal, in Georgetown, D.C., about ten blocks from where my old store used to be at Volta & 33rd.)

    Hollerith 1902

    The 1880 census had cost about $6 million and took 9 years to tabulate; the 1890 census using the Hollerith machines cost $10 million and took seven years.  The main focus of many in government was the cost differential—not the incredible amounts of new controllable information.  The rent of the Hollerith machines was only $750,000 for the conduct of the entire census, so the differential must’ve been in the extra utility costs (for electricity, for example, which was used for the first time to run the tabulators) and for the small army of statisticians and data entry people.  Be that as it may, the government was not amused, particularly when Hollerith figured that he had actually saved the government $5 million.    The two parties left each other grumbling, though the roar of the trickle down from the Hollerith success drowned it out.  The tabulating system was quickly exported, and large private concerns in the U.S. saw a savior in the system that would soon rescue them from the sea of paper in which they were beginning to drown.   The Hollerith company did very, very well for itself, and soon merged with three other companies (in 1911) to ease the burden of success.  The resulting company was called the Computing-Tabulating-Research Company (CTR), which after a short while became the International Business Machine Corporation (IBM).   

    [Source of abstract: Publications Indexed for Engineering, PIE, volume 4.]

    And the article from the Scientific American, as follows. (It is worth pointing out that a few hundred pages following is an article about William Terrel’s fantastic tide-predicting machine, a beast of a sicentific instrument that weighed in at 2,500 pounds and functioned slendidly for 30+ years…)


  • The Hearing-Aid Chair, 1837

    JF Ptak Science Books   Quick Post


  • The Mental Sorrows of Left-Handedness (1924)

    JF Ptak Science Books  Quick Post

    Nature (September 13, 1924) posted a long one-paragraph description of the work of Dr. William.S. Inman (1876-1968), who published an article in the Lancet on the causes of left-handedness, stammer, and squint, which he found were related in one form or another, and globally.  Just in case you were wondering, Dr. Inman located the causes of the problems of left-handnedness, and his were devoted “to mental causes”:

    • Left-handedness, stammering, and squinting are all caused by emotional stress;
    • “too severe parenting” can be the cause of stammering, and left-handedness, and squinting;
    • each of these “defects runs in families”;
    • a family predisposed to one is so with the other two;
    • one can become lefthanded as “an unconscious revolt against authority”.

    So, there. 

    This at least seems like a gentle and inquisitive approach to left-handedness, which, it seems, was a “defect” that historically was dealt with by corporal punishment.  For example, in the first book I can find in the global library catalog WorldCat that mentions “left-handedness”–a work by Thomas Lutpon with the long and languid title of A Thousand Notable Things containing modern curiosities. Viz. Divers Rare and Experienc’d Physical Receipts… To Educate Children to learn languages speedily…Also a new help to discourse, and directions to read, write, indite and speak languages readily and speedily…, a note is found with the description of the book saying “21st edition of this book of secrets, first published in 1586, it contains “A New Method to Educate Children” pp. 153-163 with a woodcut of alphabet cubes. The 20th edition appeared in 1706./ Some of the recipes are innocuous, others simply terrifying — in spite of this, the author’s instructions for educating children are surprisingly humane — no corporal punishment and notably, no beating to correct left-handedness”.  Now the purpose of that very long and not-so-pretty sentence was to get aross the idea that for long periods of time left-handedness was treated as something that could be beat out of someone, physically.  That at least is one very disturbing way of teaching someone how to write with their right hand.  

    ·Posted by :

    ·in: