A Daily History of Holes, Dots, Lines, Science, History, Math, Physics, Art, the Unintentional Absurd, Architecture, Maps, Data Visualization, Blank and Missing Things, and so on. |1.6 million words, 7500 images, 4.9 million hits| Press & appearances in The Times, Le Figaro, Mensa, The Economist, The Guardian, Discovery News, Slate, Le Monde, Sci American Blogs, Le Pont, and many other places… 5000+ total posts since 2008.

Category: Information, Quantitative Display of

  • Crystallizing a Scarce Perspective: Looking Straight Down & the Art of Photography

    JF Ptak Science Books   Post 2195

    There are many posts to this blog on this Looking Straight Down topic–just enter this phrase in the search box at left for a list.  

    The idea of representing a view straight down, of looking straight down from some height, is a relatively recent occurrence, this view being somewhat rare in the antiquarian world pre-balloon or pre-heavier-than-air flight.  The pre-human-flight reason for its scarcity is understandable, but even after the first Montgolfier ascension in 1787, there’s another 120+ years of scarcity yet to come before these views would start to pop up in common (and uncommon) literature..  Now I’m not talking about cartography, which is basically a straight-down view of the world—what I’m referring to is that same view but not as a map per se, but what you would see if you were dangling out of a plane or balloon. It is an unusual and scarce perspective.

    Looking down balloon181

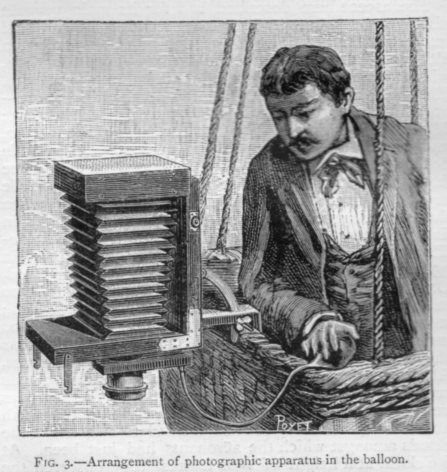
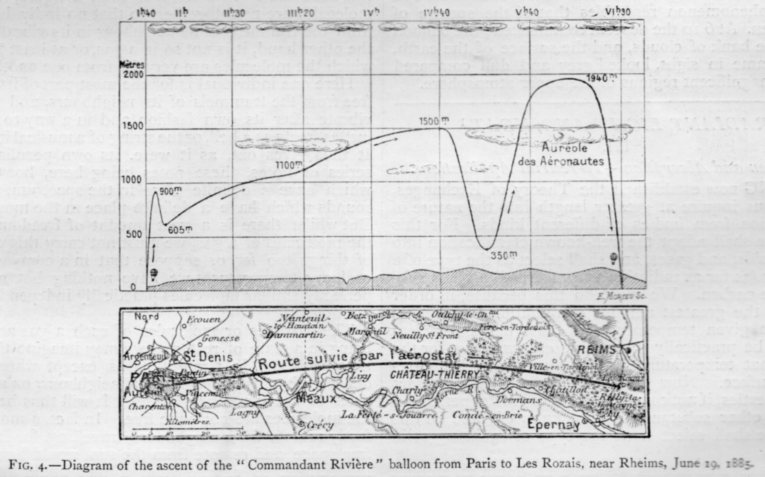
    This series of images was found in Nature (September 3, 1885, and already well established and in its third decade of publication) and shows a very scientific exploration of looking straight down. The images show the pioneer and bibliophile Gaston Tissandier and his equipment and their position in the research balloon engaged in “photographic aerostation”. Their experimentation was a clear success, the results of which were immediately applied to cartography, with the journal reporting “aerostatic photography has a great future”. And so far as the looking-straight-down part is concerned, it certainly crytalizes a moment in time in that part of visual history.


    Looking down balloon182

    And the cross-section of the map showing the progress of the Tissandier expedition and of the progress of looking straight down:

    Looking down balloon183


  • Homer Simpson on Perspective: the Rare Antique Image Looking Straight Down from a Height

     JF Ptak Science Books    Revisiting and expanding Post #20 from 2008

    Homer vitruvian

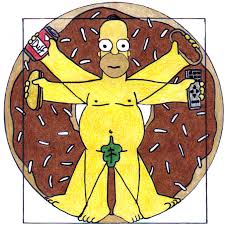
    I welcome the chance today to use our non-classical Homer instead of the beautiful Paolo Uccello to look at an issue of imaging a certain form of perspective drawing.  I’ve always been intrigued by antiquarian images that looked straight down, or up, at things–90 degree, perpendicular, real straight-on stuff, giving a feel for depth (or height) and perspective.  Funny thing is that in the wide world of scientific images, they really don’t show up very often.


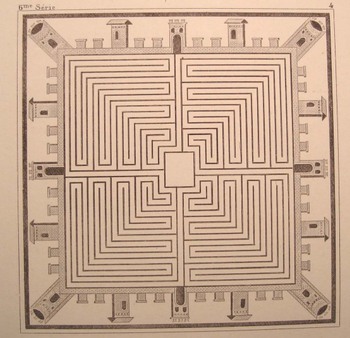
    A Mock-straight-down is found in this prettily-designed example (French, ca. 1860)–it seems to be view form a height of 250 feet or so down on the square of a low- (Western) renaissance town. That’s partly true, except that it is a mosaic from Pompeii (or Herculaneum), found embedded in the floor of one of those mummified houses. 

    Dsc04640

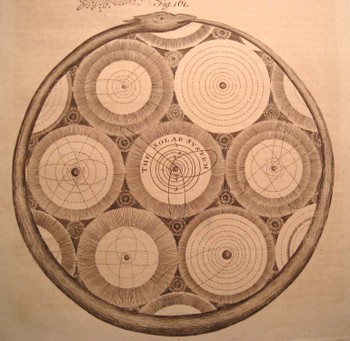
    Another pretender is this god’s-eye view (from Abraham Rees’ mammoth encyclopedia of 1800-1820) of the universe, centered upon our own helio-centric Solar System, which is centered, nested, amidst a whorl of other (contiguous and touching but not overlapping) solar systems, all of which is held in the
    infinite but knowable confines of an ourobus.   This again qualifies as a straight-down/up if and only if (iff) you squint real hard and imagine you’re seeing the scene through your CreatorView (TM!) glasses.  (The Creator needs glasses?)

    Dsc04642

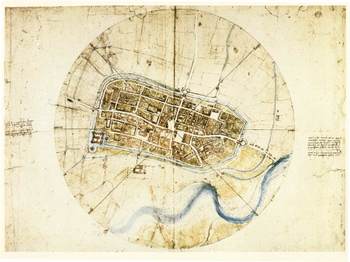
    The drawing by Leonardo of the town of Imola (currently resident with the Windsors) does come quite close to the concept–it has more artistic features than the common city plan , and is definitely at a perpendicular to its subject.

    Blogstraight_imola[Source for Imola image: www.leonardo-da-vinci-biography.com]


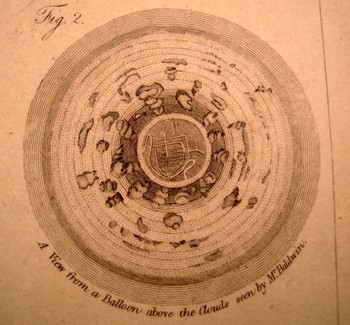
    But it is this that is so terribly interesting to me–a small part of a little print from an unidentified encyclopedia from the turn of the 19th c. It shows a picture of the earth looking straight down from a balloon, looking through an opening in the cloud cover, down to a small town. There is an iconic work on the representation of the world as known to succeeding generations where the picture of the world is seen through a succession of gradually diminishing clouds (being opened like drapes over time), but I honestly cannot think of an early image of looking at clouds from above and straight down.  My sense is that this image would have caused as muchinterest and wonder as the first (Soviet) images of the other side of the Moon (back in 1959). 

    Dsc04639_2

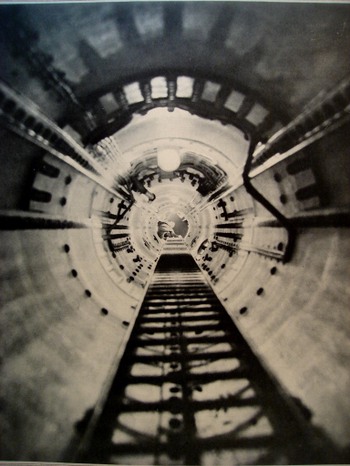
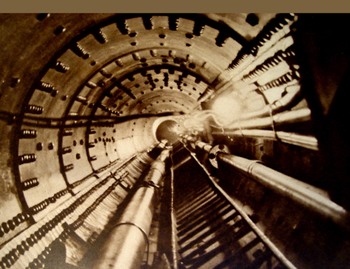
    Even when moving into the pre-satellite 20th century image, the straight-down picture is a rarity. In the last few years after having looked at dozens of thousands of popularly-published images (for another project), the straight-down/up were a scant tenth or perhaps hundredth of a percent of the total. There were a number of photographs made looking straight up (as in the two examples here, looking up the main mast into the crow’s nest of the Queen Mary, and the other with the same view, only in the Bremen. 

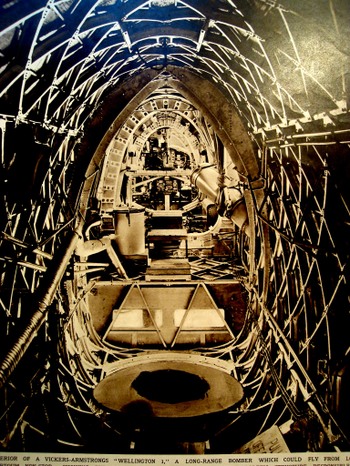
    Occasionally the view like this will show up (looking laterally through the Vickers-Armstrong “Wellington I” bomber aircraft (June 1939)

    I can’t leave this topic without mentioning two recent additions to this genre–the first is the Eames’ wonderful Power of Ten movie (go to youtube HERE, where in 40 steps we look at existence from quark to quasar. 

    Dsc04643_2

    The second is a little goofy but I like it nonetheless–the introduction to the Jodie Foster movie Contact (go to youtube HERE)  built on the bones of the Carl Sagan book. Here we swing out from the Earth and into space, following a broadcast-audio trail of humanity into the not-too-distant time/space (ignoring the signal degradation bit but so it goes), and then leaving that quickly behind, hurling itself backwards, to the outer reaches of the universe, until (and we don’t see this in the youtube clip) we wind up back in the iris of the heroine (and a bit too much like the Dave Bowman trip in “2001 a Space Odyssey”). 

    But we don’t see stuff like this very often, and I’m happy to go along for the ride. It really is just about seeing something new, after all.

    Dsc04644

    Perhaps the lack of this perspective is summed up by our old friend Homer J. Simpson. In one episode of the Simpsons (long ago and far away…or last week) Homer explains (to Lisa?) why cartoon characters’ faces are always oblique in profile. Homer turns and looks directly into the
    camera,” and his face gets all pancakey. It’s just not done “because it’s goofy” he says. And at least in Homer’s case, the proof is definitely in the puddin’.
    Dsc04645


  • Measuring Big Things in Terms of Units of Trinity Churches

    JF Ptak Science Books   Quick Post

    Follow Me on Pinterest

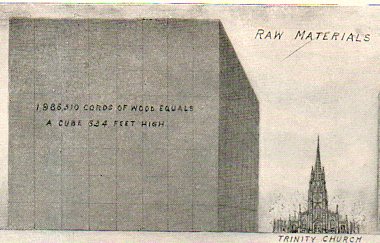
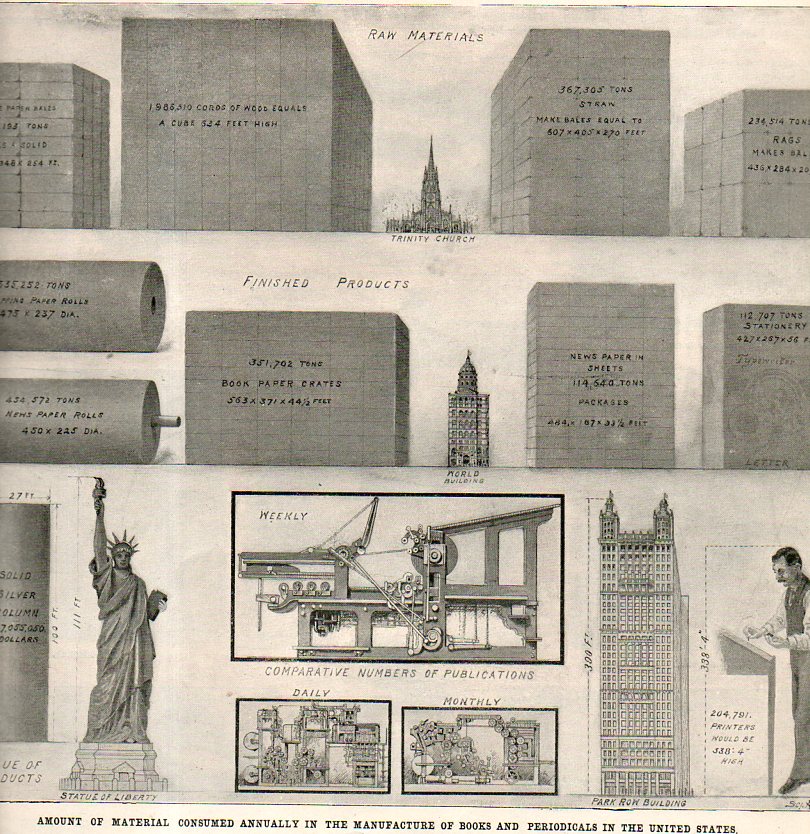
    The rather dry article appearing in the 14 November 1903 issue of Scientific American discussing the comparison of raw and finished products in the printing and paper making industry survives itself in a glorious way with a captivating infographic explaining things in terms of units of Trinity Churches and Statues of Liberty–and that’s what makes the difference in presentation of data and the artistic display of statistical information.

    Infographic a materials796And so:

    Infographic a materials795[Source:  Scientific American, 14 November 1903]

     After everything is said and done these images remind me (unfairly, probably) of Buckminster Fuller’s idea for an enormous floating city named Triton.  All things being equal, Triton probably could have worked, for good or not.

    Triton


  • A Beautiful Pre-Semi-Visionary Structuralization of Information (1733)

    JF Ptak Science Books   Quick Post  
    Follow Me on Pinterest


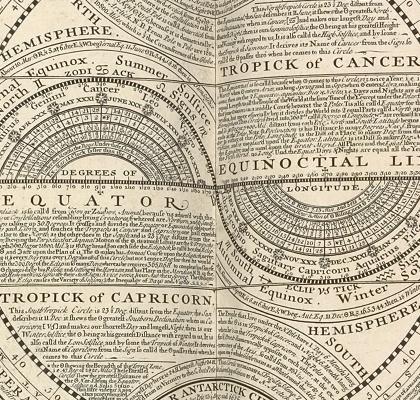
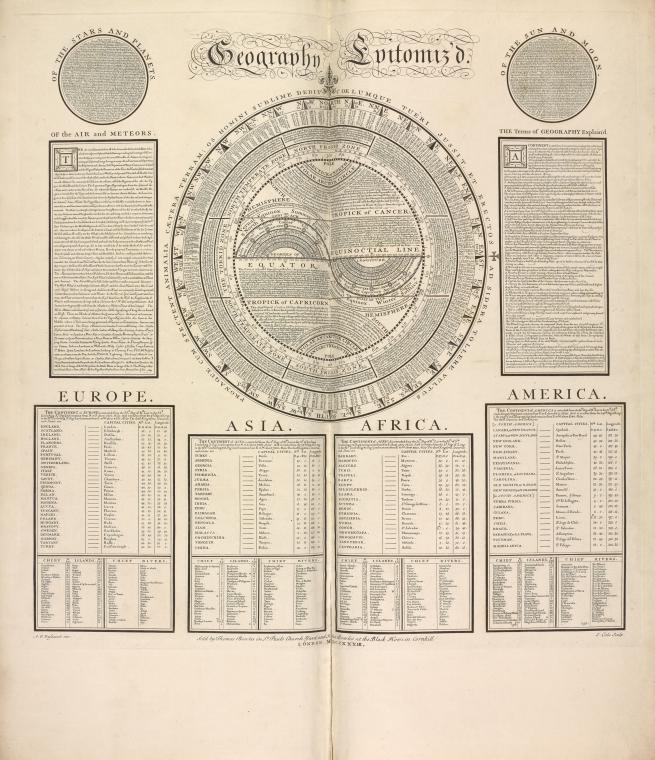
    BowlesThe central image in the opening salvo in Thomas Bowles’ Geography Epitomiz’d. Of The Stars And Planets. Of The Sun And Moon. Of the Air and Meteors. The Terms of Geography Explain’d (1733) reminds me a great deal of later visionary and outsider works.  It is a beautiful way to display and solidify vast chunks of data into a cohesive (and pretty and appealing) whole, an interesting structure that calms the dynamics of divergent information. It’s a lovely piece of design and imagination.
    [Source: New York Public Libraries Digital Collections]

    Bowles thomas


  • Propagandizing Germany’s Disarmament, 1932

    JF Ptak Science Books   Post 2123   
    Follow Me on Pinterest

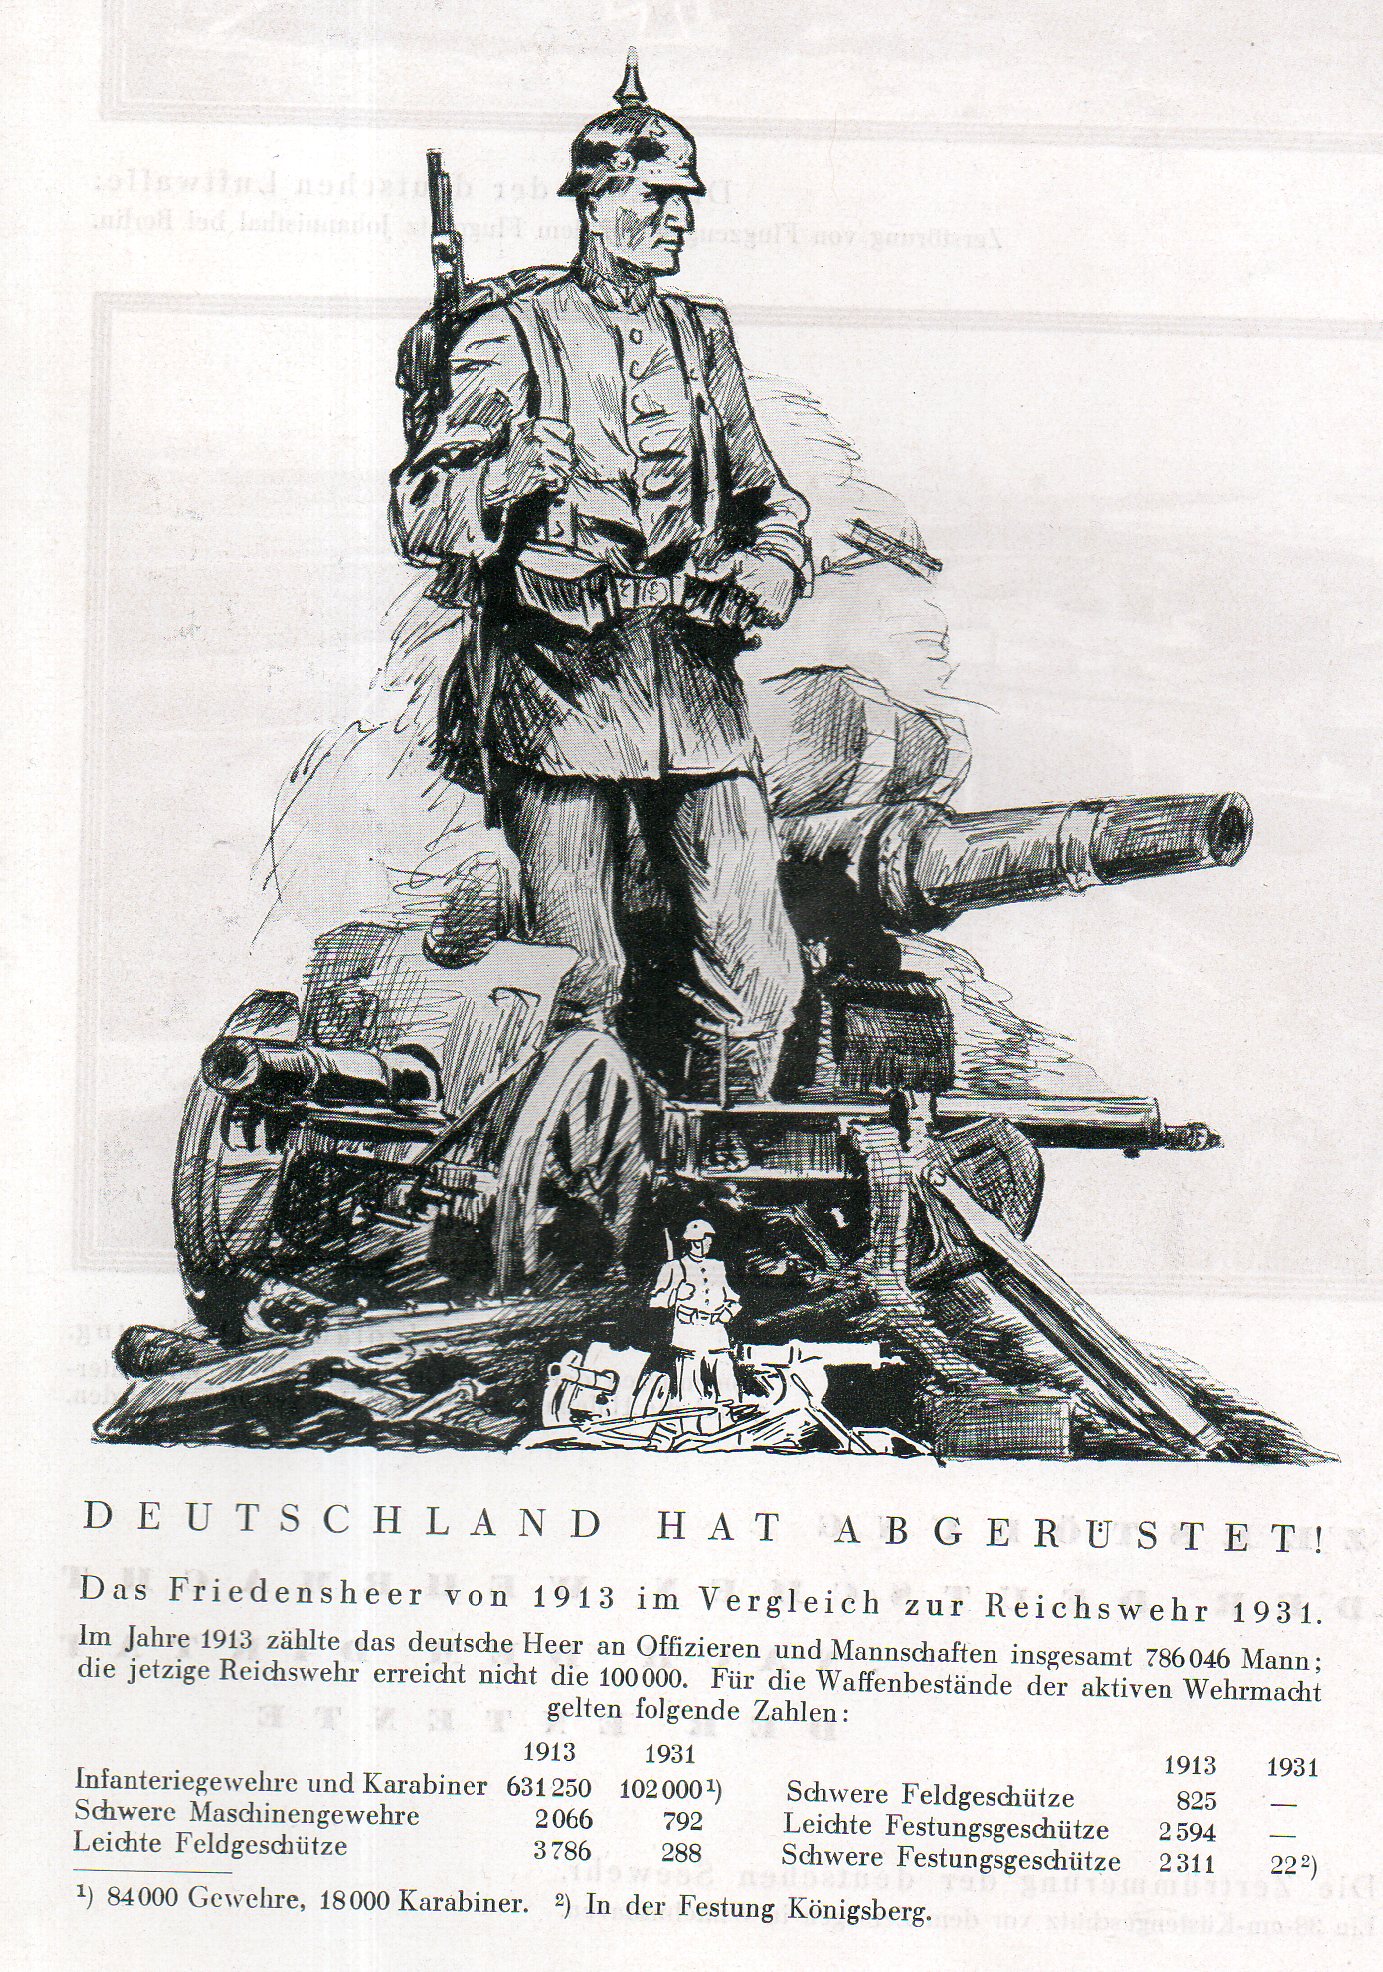
    This image comes relatively early in the history of the German rearmament and the subsequent march to WWII.  These infographics come from the Illustrirte Zeitung (Leipzig) in March 1932 and depict the various low levels to which the German military had reached. Germany’s military situation was dictated by the terms of the Treaty of Versailles some six months after the Armistice was signed, the terms of which were decided over months and for which Germany was not an invited member to the negotiations. In any event, the protocols of the treaty were fairly strict (some felt not strict enough, while others like J.M. Keynes felt the economic restrictions and concessions were too harsh), and so far as the military was concerned the army, navy, and air force were all severely limited in size and development.

    The 1919 treaty began to unravel in earnest by 1932, at which time Germany–reeling still from the Depression and from the economic hardships and concession placed on it by the treaty, suffering large unemployment and with a disastrous economy–by June of that year had decided to ignore the military restrictions of Versailles and sought to rearm.  By July Germany withdrew from the nearly half-trillion-dollar (in 2013 American dollars) concessions agreement, and started to accumulate funds for a vast new military restructuring program. In a year Hitler was chancellor, and the Nazi Party made huge gains in the Reichstag.  And the war was in motion.

    Few people in Germany would have to be reminded that the military was in dire straights, but these infographics hammered the point home in a very stark visual manner. 

    Propaganda Germany 1931113(“Germany is Disarmed!” shows the difference in man- and fire-power between 1913 anbd 1932)


  • Welcome to October: Make Your Own Baseball Paper Computer (1961)

    JF Ptak Science Books Quick Post

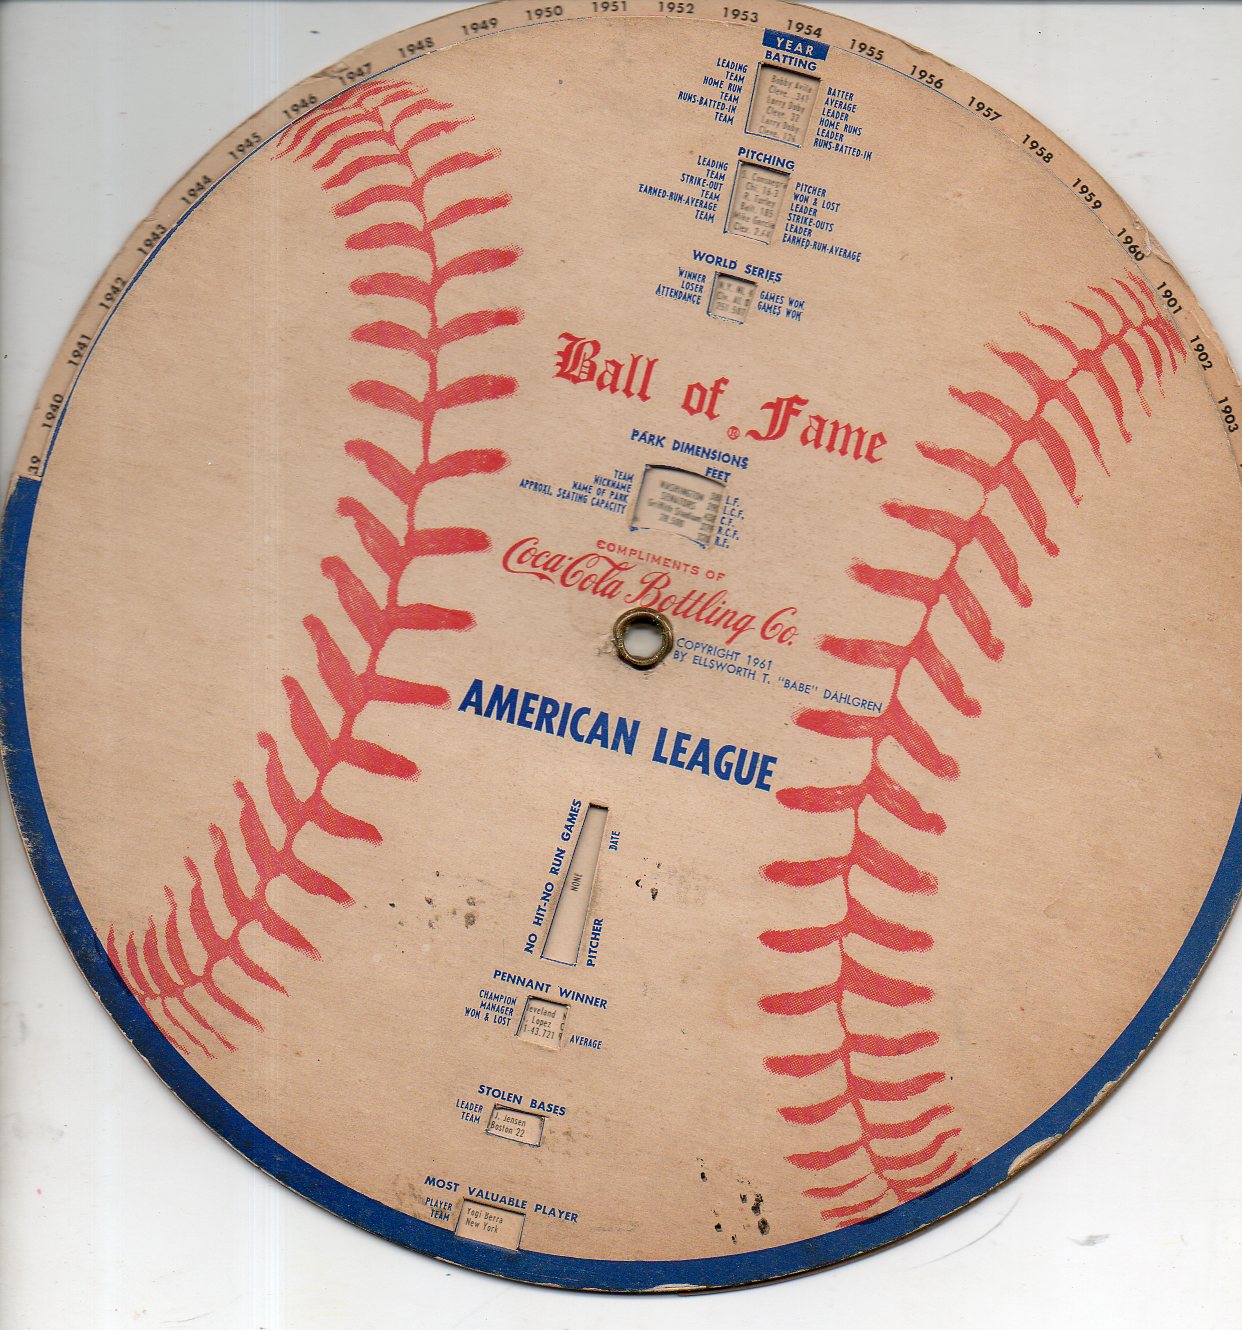
    I’ve accumulated 50 or so paper computer/calculators of various shapes and sizes and descriptions, ranging from calculating the mileage for a 1959 Rambler, the ground speed for a B-25, radiation dosimetry, one-handed bridge, nuclear weapon yields, political history quizzes, and many others–including this “Ball of Fame” baseball historical paper volvelle. 

    Ball of fame719
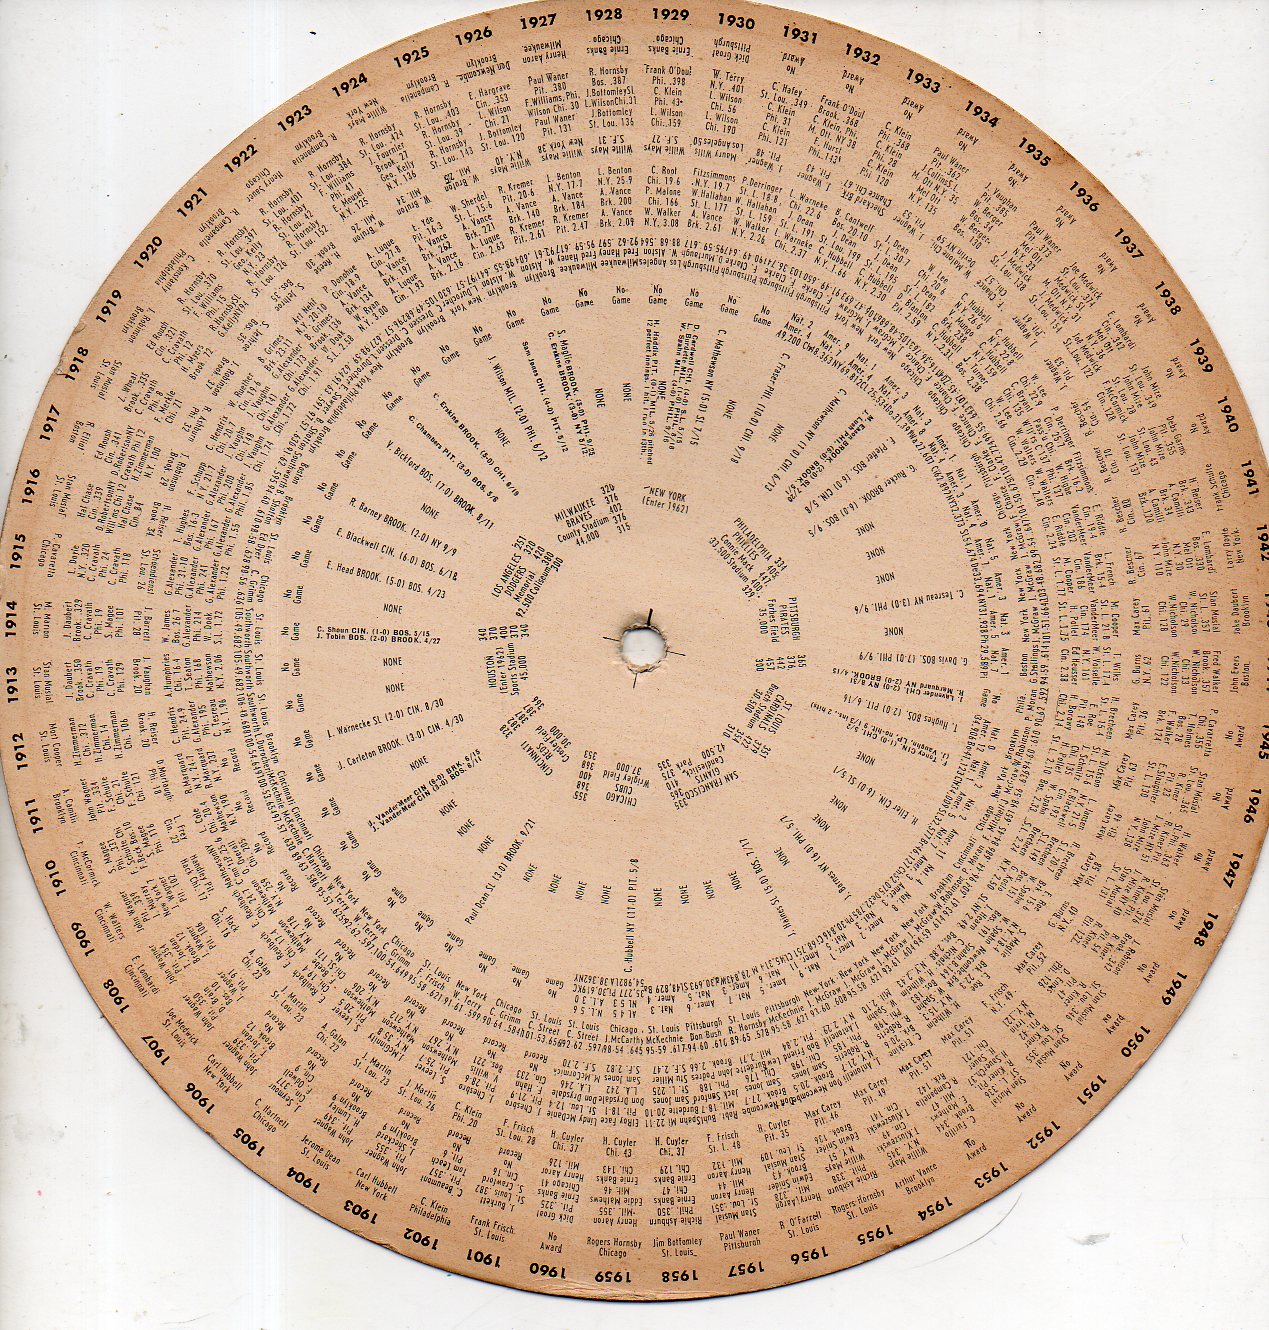
    I’ve seen this online a bit, but I’ve not seen the guts/data of the thing, so I decided to take mine apart and scan it so that the baseball folks among the readers of this blog can make their own. I’ve scanned at 200 dpi so there’s plenty of detail–just print out the four sections, grab your exacto knife, and you’re in business. 

    Ball of fame721

    The computer has an awful lot of detail, the most interesting to me being located at top-center, for “Park Dimensions”–in that quarter-inch square window we see info for the team, nickname, name of park, seating capacity, and the distances to the five points of the fences. Terrific!  The rest of the info, fpr the years 1901-1960:

    • Batting (showing leading batter, team, average, home run leader, leading team for home runs, rbi leader and rbi team leader).
    • Pitching (showing leading pitcher, w/l record, team, KO leader, team strike outs, ERA pitching and team leaders.
    • Pennant winner: (showing the winning team, manager, W-L, and winning percentages.
    • Stolen bases: leader and team leader.
    • And, lastly, MVP. 

    There are bits and pieces that wouldn’t fit the scanner, but they’re replaceable. 

    Have fun!


  • Fossils of Almost No Value? Statistics, Prisons, and Meaninglessness.

    JF Ptak Science Books   Blog Bookstore 
    Blog--May 23--convict The fossil record is generally one of the richest and most
    compelling histories of the development of life on earth, a far-reaching,
    cumulative record of extraordinary importance. 
    There are the other, occasional, fossils that stand only by themselves,
    and seem to have almost no use in the current time, living almost entirely
    within themselves. The following statics seem to fall into that category—they
    seem to be only a tombstone for an era, providing nothing except to tell the story
    of what happened, existing only for that purpose, with no compelling
    utilization for anything outside understand a small piece of life for the year
    the stats were gathered. 

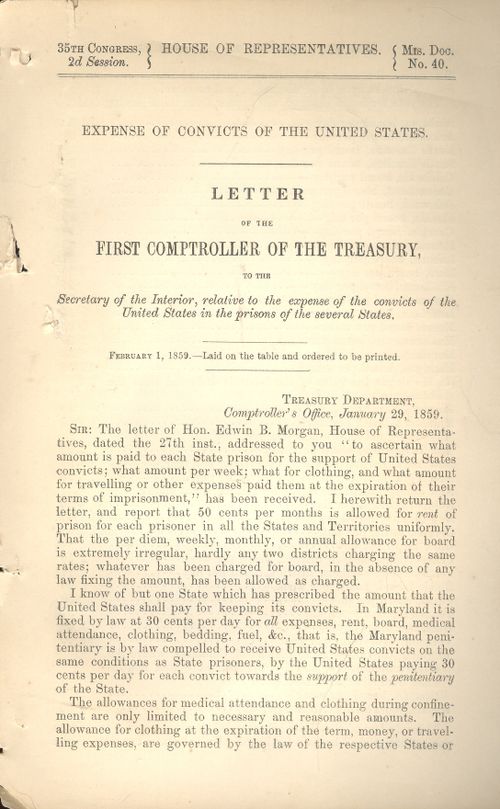
    The cause for this sentiment was found in a government
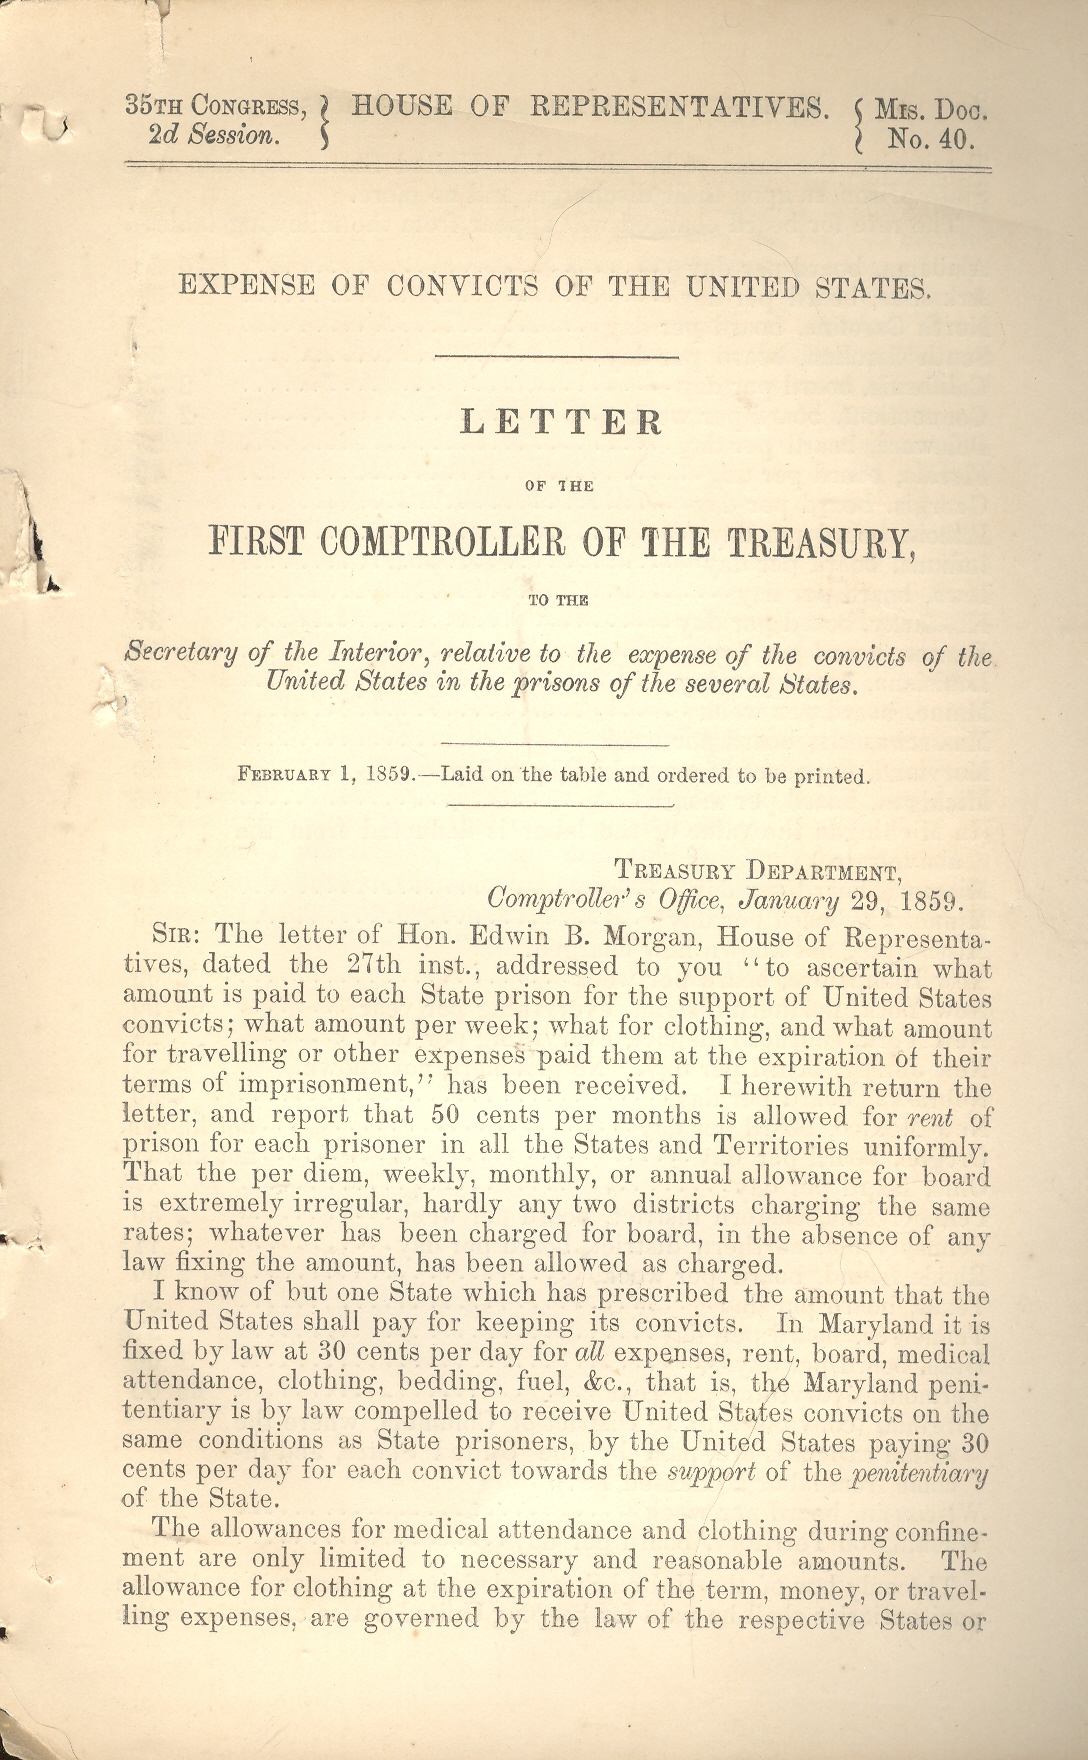
    publication called Expense of Convicts of the United States  (Letter from the
    Comptroller of the Treasury…)
    , 1 February 1859).  The following comes in the first paragraph:

    “I….report that 50 cents per months is allowed for rent of
    prison for each prisoner in all the States and Territories uniformly.”

    What this means is that the U.S. Treasury would pay 50 cents
    to the state for keeping a federal prisoner. 
    That is 50 cents per month, or about 1.7 cents per day. And that was
    also for rent of the cell, exclusive of all else, each state furnishing the
    government with the added cost, separately.

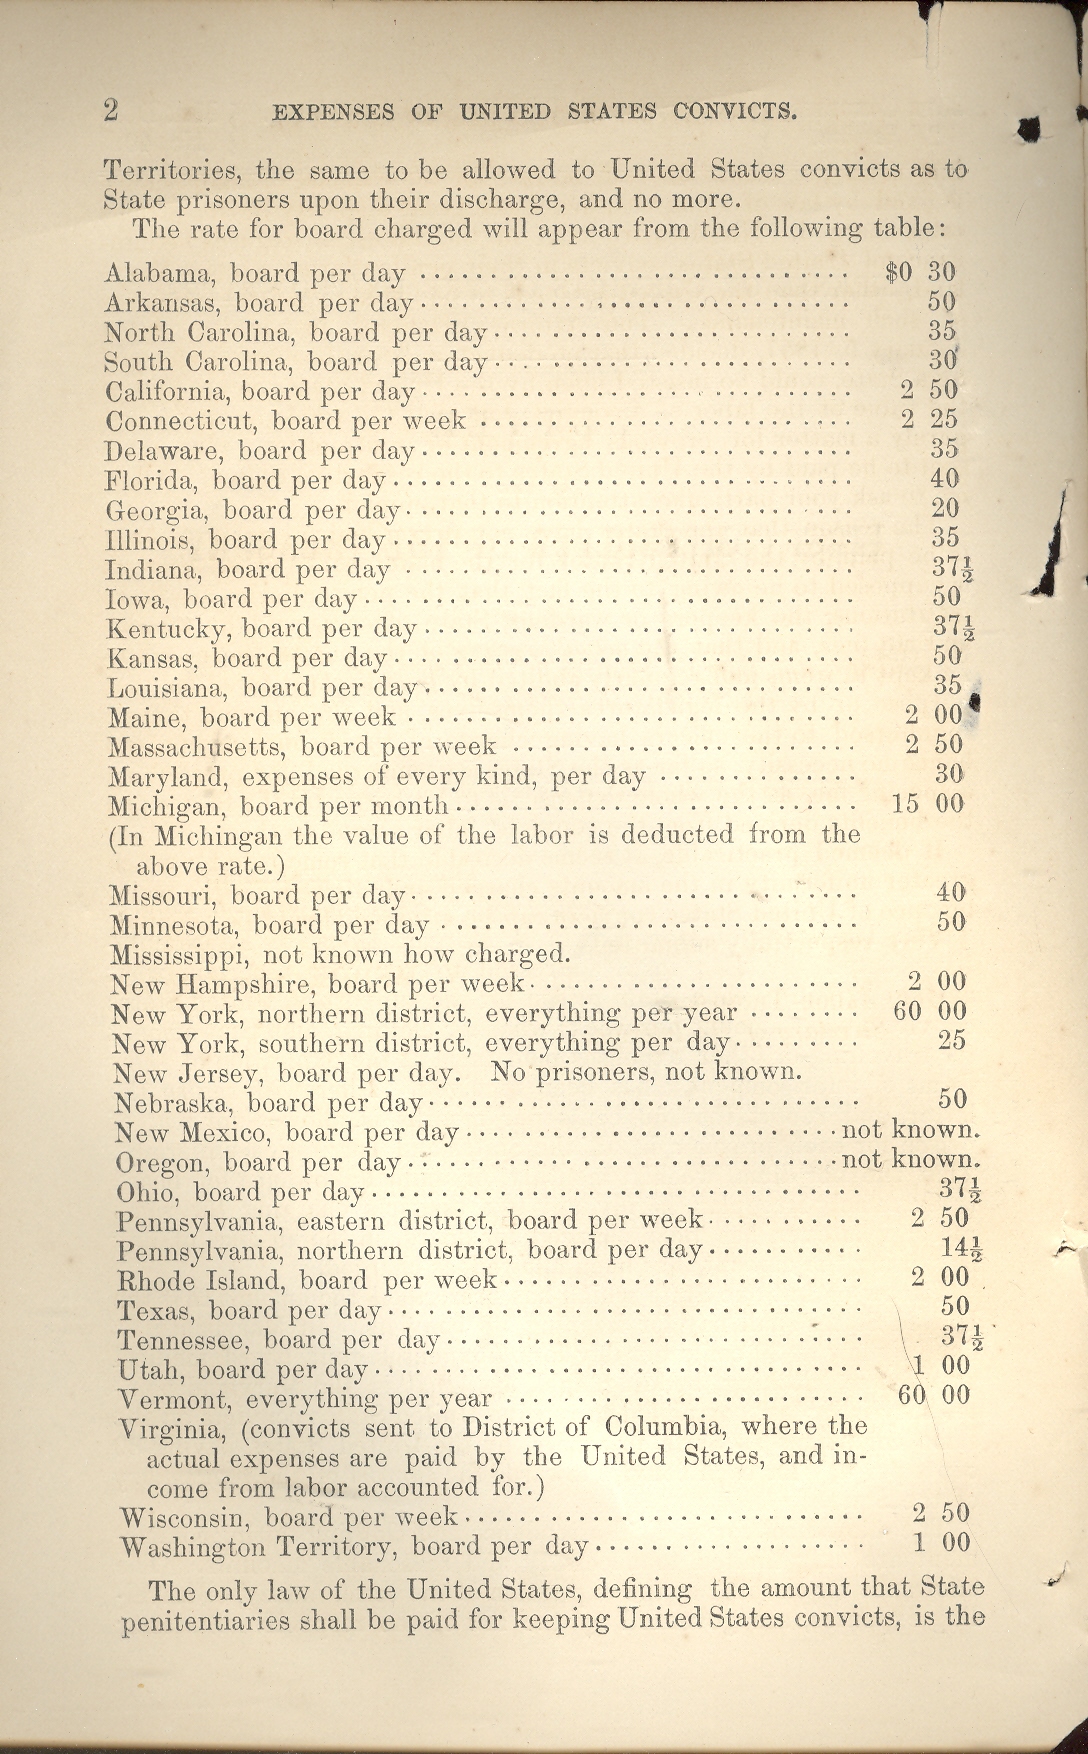
    Evidently the only state in the country that prescribed an
    exact amount for keeping a federal prisoner in a state institution was
    Maryland, “which received 30 cents per day for all expenses, rent, board, medical attendance, clothing, bedding,
    fuel, and etc” (italics in the original). 
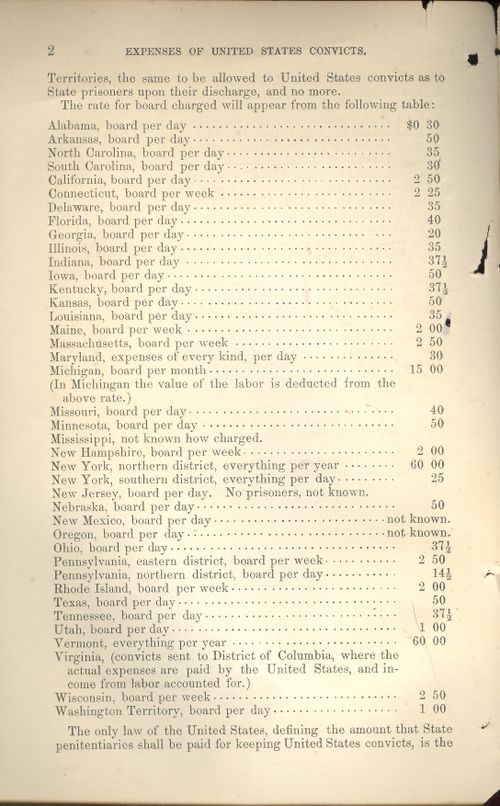
    The rest of the states and territories had diverging and different
    expenses, from the southern district of New York at 25 cents a day for board,
    and ranging up to about 50 cents per day in  Michigan. Vermont charged an extra 60 dollars a year, in addition to the 6 bucks that they would
    get for the rent of a Vermont
    cell, to keep a prisoner—all expenses included—for one year, or about 18 cents
    per day, total. 

    Unfortunately I don’t have the stats of how many federal
    prisoner there were in 1859, so I don’t know how much of a percentage of the
    budget was occupied by prison expenses. 
    But what I do know is that even with tossing around the CPI with
    multiplier effects and so on the figures translate in no way to keeping a
    person in prison today.   The cost of
    housing someone in prison per year is around $35,000 a year, or $100 or so a
    day.  Adjusting the 1860 dollar via CPI
    for 2009 makes that dollar worth about 25 dollars today, which would be a
    doubling and a doubling again of keeping someone in prison. 

    I’m not so sure that those figures tell us much about what
    we pay, today. 

    Next, I was having a breeze through The Prison System of the United States by S.J. Barrows
    (Commissioner of Prisons for the U.S.) which was published in Washington  in 1900.  One particularly interesting
    section was the publication’s solitary statistical table, “Appendix A”, which
    detailed the crimes of the 625 men incarcerated in the state of Michigan  in 1900.  Well over half of all those in prison were
    there for larceny and burglary, while about 12% were in the big house for
    violent crimes.  (Evidently 95% of this
    number were literate and 70% could “cipher” (that is, produce basic arithmetical
    skills)).  The total crime list (such as
    it was) includes the following:

    Capital crimes (murder in the first and second degree) and
    manslaughter, along with murderous assault comprised about 1% of the total
    prison population.  Other violent crimes
    included assault with intent to do great bodily harm, rape, attempted rape,
    rape and assault composed another 3%. Further assaults were classified under
    (a) with intent to do great harm;  and
    then as assault on a female under 14 years; and on a female under 16 years  There were also the sexual assaults:  taking indecent liberties with female; with
    male child;  unlawful and carnal
    knowledge of a young child;   inducing female to enter house of ill fame.  These last two categories included about 5%
    of the prisoners.  Set aside form these
    were the crimes of adultery, abduction, incest and sodomy, which included
    another 3%.  So it seems that the violent
    offenders in prison in  Michigan 
    in 1900 totaled out at 12% or so. 

    Burglary and larceny were the  largest categories, being subdivided into (a)
    burglary accompanied by actual assault; (b) larceny; (c) larceny from a
    dwelling;  (d) larceny from a shop in daytime; (e) attempting larceny from
    the person; (f) entering a church in daytime to steal; (g) breaking and
    entering a store in daytime;   (h) breaking and entering a store in
    nighttime;(I)  breaking and entering a
    dwelling in daytime; (j)  breaking and
    entering a dwelling;  (k) breaking and
    entering a railroad car.

    Then there were a few largely vacant offenses:  Resisting an officer; Uttering and publishing
    a forged note, breaking out of prison, perjury, arson, false pretense, and
    malicious destruction of personal property, all combing for less than 2% of the
    jailed population.
    Blog--May 23--convict 001

    The vast majority of prisoners in Michigan were imprisoned for non-violent
    crimes.  The federal fathers, in the
    meantime, recognized that people in prison shouldn’t be idle while paying their
    debts to society, and should fill their time with work that would occupy the
    prisoner and bring some income into the prison system:

    “The moment we apply to the convict a
    different system of economics because he is in prison we go astray. When we
    subject to analysis the plans proposed for abolishing the competition of
    convict labor we find them based on false principles or expecting results not
    to be realized. The wiser way for the peace of society and the interest of the
    State is to place prison industries on the same ground as free industries, and
    defend that.
    It is also said in opposition to the contract system that
    contractors do not pay as much for the labor of convicts as free laborers
    command.”

    In 2005 the federal offenses for which people are incarcerated include: Drug
    Offenses 59.6%; Robbery 9.8%;  Property
    Offenses 5.5%;  Extortion, Fraud, Bribery
    6.8% ; Violent Offenses 2.7% ; Firearms, Explosives, Arson 8.6% ; White Collar
    1.0%; Immigration 2.8%;  Courts or
    Corrections 0.8%;  National Security
    0.1%;  Continuing Criminal Enterprise
    0.8%;  Miscellaneous 1.5% .  54% of prisoner in state custody for the same
    time were incarcerated for violent crimes, with drug offenses coming in at 20%
    and property crimes at 19%.  The racial
    breakdown of prisoners in the U.S. is another tragedy: of the prison population
    in toto of 2.3 million in 2008 there
    were 4,777 black male inmates per 100,000 black males held in state and federal
    prisons and local jails, compared to 1,760 Hispanic male inmates per 100,000
    Hispanic males and 727 white male inmates per 100,000 white males—that means
    that the black incarceration rate was double and then double and then
    half-doubled again that of whites.  What
    this also means is that there were more blacks in jail cells than in college
    dorm rooms in 2008.

    I’m not sure that any amount of creative statistical mathemartistry could bring these figures to life for some sort of practical application in 2009, the present situation in the prisons being so immense and pervasive.  Numbers and assorted data from the past usually have the capacity to help us see where we are today; as I said earlier, I think that these fossils are simply that:  dead.


  • A Composite Photo of Mistakes, 1885 (Or: Imaginativeness vs. Comb-overs?)

    JF Ptak Science Books   Post 2097  
    Follow Me on Pinterest

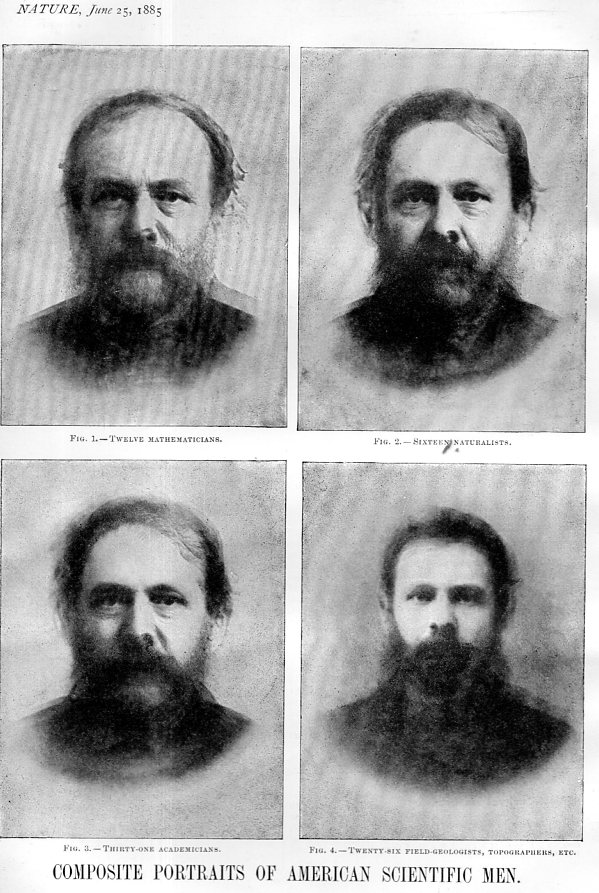
    Building on some reaching and questionable physical identification work of Sir Francis Galton, Raphael Pumpelly tried to make photographs of what scientists looked like. 

    At a scientific meeting of the National Academy of Sciences in Washington,  D.C.,  Pumpelly (along with Dr. (Thomas Mayo) Brewer and the Secretary of the Smithsonian Institution, (Spencer F.) Baird) undertook the experiment to determine whether or not there was a certain composite “type” in groups of academicians.  He employed the justly-named head of the photography department at the NAtional Museum, Mr. (Thomas Mayo) Smillie, to make a series of 2-second exposures of the scientists upon a single glass plate.  Two seconds per portrait was not long enough to make a defined portrait for a single sitter, but if there 15 or 30 such exposures on the same plate it was seen that collectively a strong impression would be produced.  The resulting portraits are interesting in their own way, but probably not so interesting without the backstory.

    Composite593
    The problem of course is the interpretation and what could come of classifying external characteristics for internal capacities, which would make this exercise as useful as cranial bump reading or body mole mapping. 

    Also it is unclear that if you didn’t identify these images as composites of leading American scientists but were told that they were pictures of murderers or meat thieves or sneak burglars, it would be as easy to believe.  Instead of identifying their characteristics of “intelligence” and “imaginativeness”, changing the grid-of-explanation to criminality would certainly change those readings to something else.

    [The original paper is available via our blog bookstore, here.]


  • On Freedom of the Press and Attacking Censorship from Prison, 1812

    JF Ptak Science Books   Quick Post

    1812572

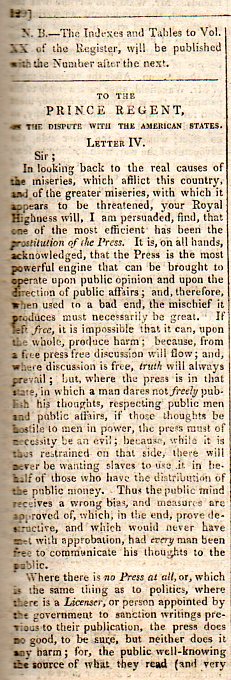
    This is really very good:  on distinguishing the free press with what it is and what it isn’t. The art icle appeared a few months before the official declaration of war between the U.S. and the U.K. (June 1812) in Cobbett’s Weekly Political Register. It was written by William Cobbett (1763-1835) and I think that this was a direct and very vocal reaction to the government’s instituting a tax on newspapers such as this–adding a tax made the journal not affordable to but a select class, thereby limiting circulation and being a de facto censor for the distribution of information. 

    He was also writing this from prison.  Cobbett was sentenced to a two years’ term in famous/infamous Newgate, sent their for treasonous libel after having written an anti-flogging article. He was also by that point a pain in the side of the government, and was paying for other perceived transgressions as well.

    Evidence of the ‘crime”–the limiting tax stamp:

    1812573

    And the article:

    1812571


  • “Teaching Britons When to Hide”, 1915

    JF Ptak Science Books  Quick Post

    Dirigible563
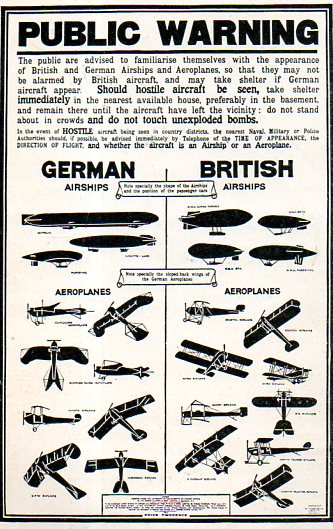
    This warning to the public appeared four months after Germany began to bomb the U.K. from the air using lighter-than-air airships. There’s also a section for identifying heavier aircraft, but bombing by that means didn’t start evidently until 1916. 

    Dirigible562[Source:  Technical World Magazine, May 1915, page 336.]

    “Zeppelins
    (airships) performed about 51 strategic bombing raids during World War
    I. These raids caused numerous civilian casualties, killing 557 and
    injuring another 1,358 people. More than 5,000 bombs were dropped on
    towns across Britain, causing £1.5 million in damage. 84 airships took
    part, of these 30 were lost, either shot down by enemy action or lost in
    accident. The raids, though disconcerting to civilian morale, were militarily ineffective.”–Wiki

    Bombing from Zeppelins was very problematic–in the beginning of the bombing raids, mostly throughout 1915, the Zeppelins were able to fly beyond the reach of anti-aircraft weapons, and at certain altitudes just beyond this reach they could carry a relatively heavy load of bombs.  The drawback was that bombing from this height was extremely haphazard, with little accuracy, which meant that most of the targets wound up being civilian areas, creating the term “baby killers” for the Zeppelins.  In the next year when British defenses against the machines improved, the Zeppelins flew higher, which necessitated oxygen and a lighter payload, and more inaccuracy.  Towards the middle/end of the war German command went more with bombing Britain from aircraft (like the Gotha) more so than Zeppelins.  The end result was not very militarily effective, causing 2,000 mostly-civilian casualties. I’m not so sure about the use of the word “strategic” in the Wiki description.

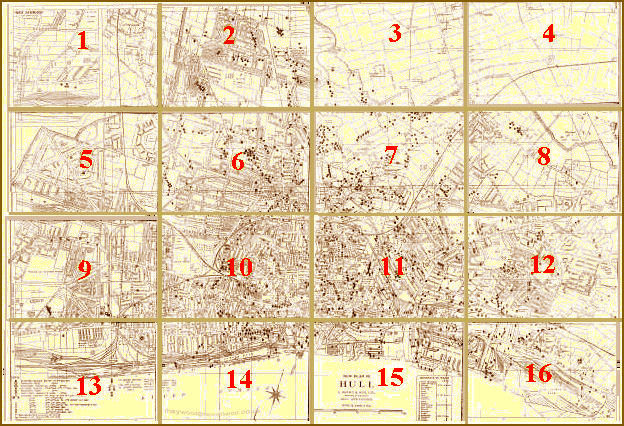
    Let’s remember the city of Hull, which received eight attacks during the Great War, only a prelude to the massive attacks it would receive during WWII. 

    Hull Blitz Map, WWII, here