JF Ptak Science Books Quick Post
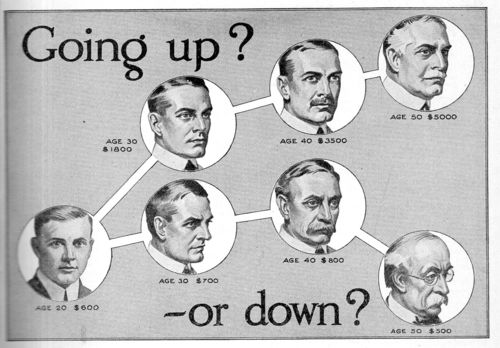
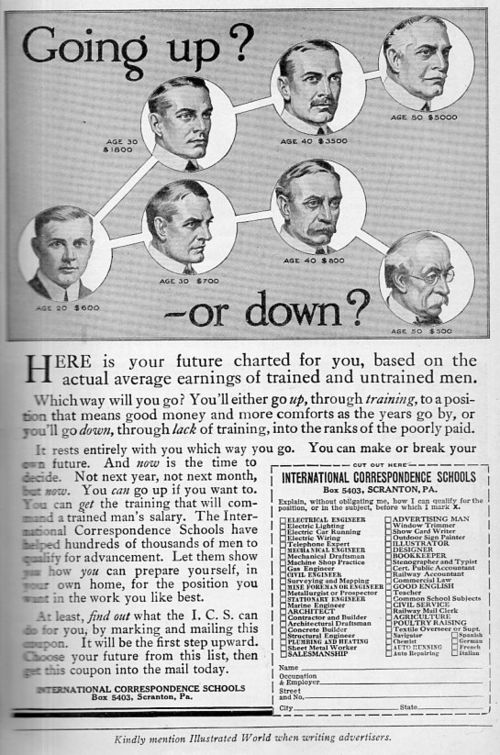
Earlier in this blog I made a quick post for an interesting graphic for the American School of Correspondence--here we have another design intimating a medico-sociological structure based upon income. It probably isn't that far from the truth, though I seldom see it displayed in such a fashion. No doubt the difference in facial appearances and their associated income has to do with the level of work and the draining effect of long-term physical work. This image was published in Illustrated World in February, 1916--at this point, life expectation for males was about 50 and females about 54
Life Expectancy in the U.S. 1900-1930
Male Female
|
1900 |
46.3 |
48.3 |
|
1901 |
47.6 |
50.6 |
|
1902 |
49.8 |
53.4 |
|
1903 |
49.1 |
52.0 |
|
1904 |
46.2 |
49.1 |
|
1905 |
47.3 |
50.2 |
|
1906 |
46.9 |
50.8 |
|
1907 |
45.6 |
49.9 |
|
1908 |
49.5 |
52.8 |
|
1909 |
50.5 |
53.8 |
|
1910 |
48.4 |
51.8 |
|
1911 |
50.9 |
54.4 |
|
1912 |
51.5 |
55.9 |
|
1913 |
50.3 |
55.0 |
|
1914 |
52.0 |
56.8 |
|
1915 |
52.5 |
56.8 |
|
1916 |
49.6 |
54.3 |
|
1917 |
48.4 |
54.0 |
|
1918 |
36.6 |
42.2 |
|
1919 |
53.5 |
56.0 |
|
1920 |
53.6 |
54.6 |
|
1921 |
60.0 |
61.8 |
|
1922 |
58.4 |
61.0 |
|
1923 |
56.1 |
58.5 |
|
1924 |
58.1 |
61.5 |
|
1925 |
57.6 |
60.6 |
|
1926 |
55.5 |
58.0 |
|
1927 |
59.0 |
62.1 |
|
1928 |
55.6 |
58.3 |
|
1929 |
55.8 |
58.7 |
|
1930 |
58.1 |
61.6 |


Comments