JF Ptak Science Books Quick Post
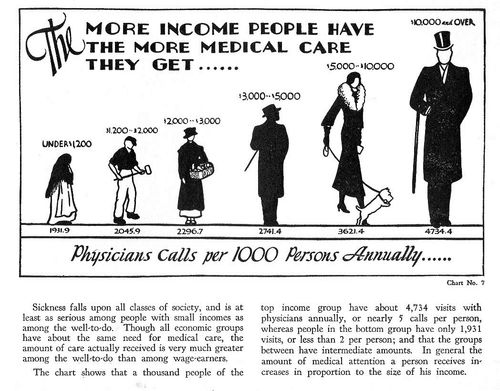
A Picture-Book about the Costs of Medical Care was composed by the Julius Rosenwald Fund in 1932. One of the major data visualizations in the short pamphlet was the distribution of medical care according to income--and it comes as no surprise that during the Depression that the wealthiest people are enjoying more medical care than the other classes. The stats are mostly not displayed in this pamphlet so there's not much that I think I can say about them--except that it seems that the class distinctions/percentage in this chart are similar to the William Thompson & Joseph Hickey (2005) class model.
So from the Rosenwald Fund the numbers are described like so (with the addition of the bureau of Labor Statistic's calculated figures for teh purchasing power of the 1932 dollar in 2016):
- <$1,299, 15% of the population, ($20,957 in 2016 dollars)
- $1,200-$2,000, 35% of the pop, ($34,938 in 2016 dollars)
- $2,000-$3,000, 25% of the population ($52,392 in 2016 dollars)
- $3,000-$5,000, 15% of the population, ($87,321 in 2016 dollars)
- $5,000-$10,000, 7% of the population, ($174,643 in 2016 dollars)
- $10,000+, $2.9% population, (greater than $174,643 in 2016 dollars)
The Thompson/Hickey model
- Upper 1%
- Upper middle class 15%
- Lower Middle Class 32%
- Working class 32%
- Lower classes (including the working poor 20%
The bottom two classes in the Rosenwald could constitute the poor and the working poor, making 50% which is what is most in-line with the Thompson/Hickey model. It is a little more difficult to work the numbers and try to distinguish the super rich, rich, upper middle class, and middle class in other models against the Rosenwald graphic. However when you look at two other models the poor and the working poor add up to about the same as above; the Dennis Gilbert model (2002) finds 55% in this category and the Leonard Beeghley (2005) finds 57%. This is real smashmouth statistical surfing, I know, but it does seem as though there is a good correlation between the Rosenwald working class/working poor/poor numbers from 1932 and more recent models.


Comments