JF Ptak Science Books Post 1864
 Though the U.S census has been completed decennially ever since 1790, the first census atlas wasn’t published until 1870. The issue wasn’t desire, of course—it was the time that it took for calculation, analysis and design that prevented them from having been published before this date. It was still a monumental task of producing an entire atlas of visual displays of quantitative data.
The first atlas (produced under the direction of Francis Walker, who was the chief of the 1870 census) was printed in 1872, and was smaller, shorter and less graphically involved the later atlases, but it was the first, and it did present information in a way seldom seen before in the United States. The first truly spectacular census atlas was produced twenty years later in 1890—it is elephant folio in size, and just a physically huge undertaking, and beautifully printed via chromolithography. It set the foundation for the two subsequent atlses of 1900 and 1920
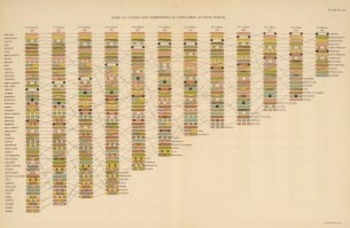
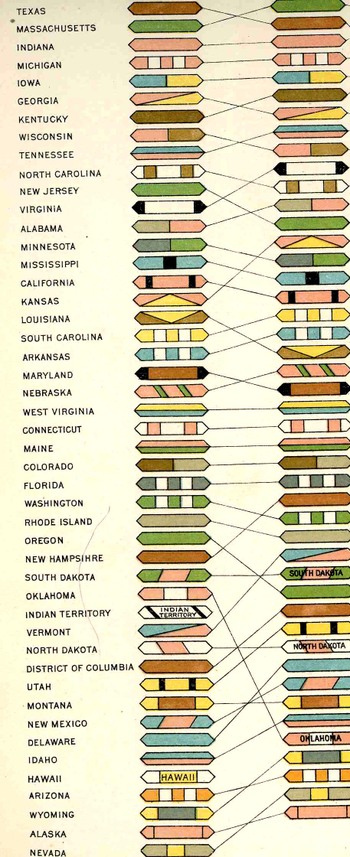
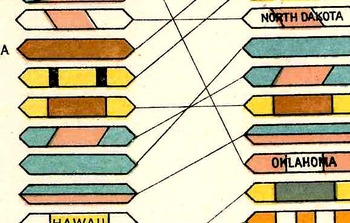
The folding plate Rank of states and territories in population at each census (prepared under the supervision of Henry Gannett, Geographer of the Twelfth Census, printed at the Census Office in 1903 by Julius Bien & Co., N.Y.) from the 1900 census is nearly identical to the 1890 version, only it is about 1/4 of the size. This graphic representation is remarkable because it displays and tracks a total of 348 data points (over time and ranking) using only eight colors. (This atlas has been in my house a long time, and I've known about this plates forever, but I honestly never counted the colors--it is a surprise, really, to see that it was just eight colors being used in what seems like a dazzlingly different assembly of color.) The key was employing different shapes within the 6-sided polygon, making for the whole mass of objects and lines to be much more simply followed. Using more color rather than distinctive shapes-within-shapes would’ve made for a wall of color that would’ve been far less intuitively trackable. This is just simply a fantastic achievement of data display--even if it takes a little while to train your eyes to become familiar with the geomertic shapes and sizes, it becomes quite easy to use.
(Just for the record, the states in the United States at the beginning of each census over the first twelve censuses are: 1790, 14 states; 1800, 16; 1810, 17; 1820, 23; 1830, 24; 1840, 26; 1850, 31; 1860, 33; 1870, 37; 1880, 38; 1890, 44; 1900, 45.)
For a complete display of the 1900 atlas, see HERE.


Comments