JF Ptak Science Books Post 1437
There is a recurring thread in this blog on resurrecting displays of information--data that was presented in an interesting way, but which has been passed over by time and forgotten interests.
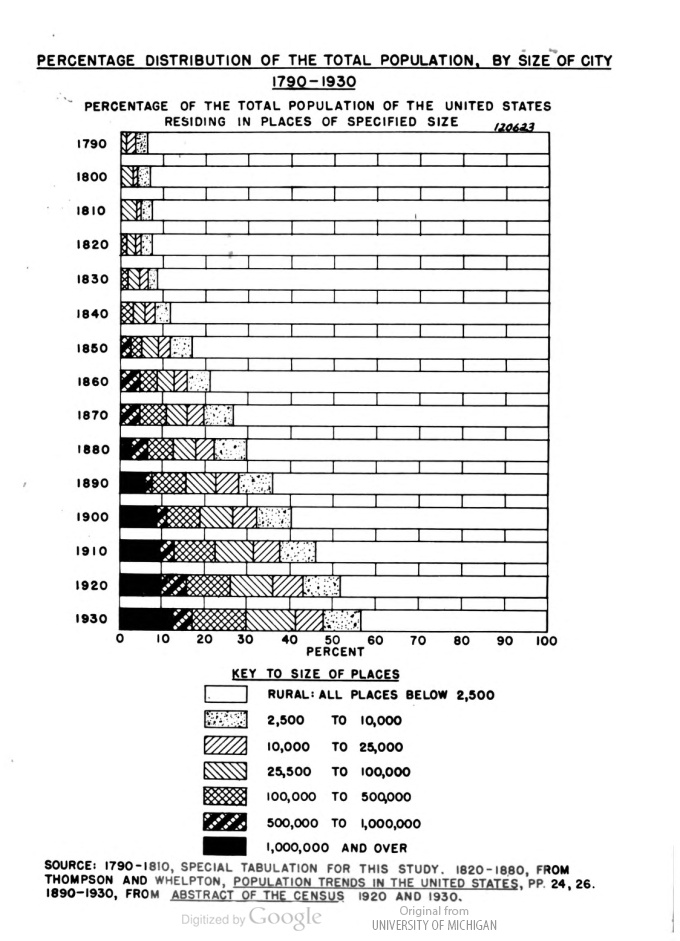
That's how I came to the Interim Report to the National Resource Committee by the Research Committee on Urbanism, by C(larence) A. Dykstra (1883-1950), published by the NRC in 1936. There were some interesting and odd bits of info in this report, not the least of which was this graph, which shows the steady growth of urbanism--of people living in cities, and progressively larger ones at that--and how quickly it occurred.

[This image as you can see was taken from Google digitized books--I used this rather than spread this book out beyond how it wanted to be spread on the scanner.]
For example, in 1880, fifty years before this study began, 18% or so of the U.S. population lived in a city with a population of 25,000 or more. By 1900, that number had increased nearly double, to 32%; 30 years later, the number was up to 40%. It was an interesting graphic, especially considering it was done for background information for people working for the NRC who were going to go out and collect census-like material with the goal of establishing the condition of American cities in the height of the Depression. It was an unexpected find, this graphical semi-precious stone, and I'm happy to have seen it. Although I've seen this data displayed elsewhere--mainly I think in the Statistical Atlas for the census of 1920--I do not remember it being presented in this manner, or with this clarity. And of course it was deeply buried.


Comments